¶ Customer usage
- Overview
- Filters
- Table
- How values are calculated
- Export and column management
- Examples
- Important notes
- Related pages
¶ Overview
The Customer usage report lists how much data each customer has downloaded and uploaded, and how much online time they have accumulated, over a chosen period. Use it to spot heavy users, audit plan utilization, or check session activity for billing or support investigations.
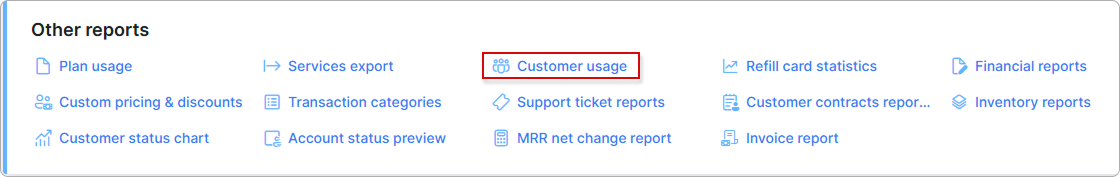
Open Administration → Other reports → Customer usage:
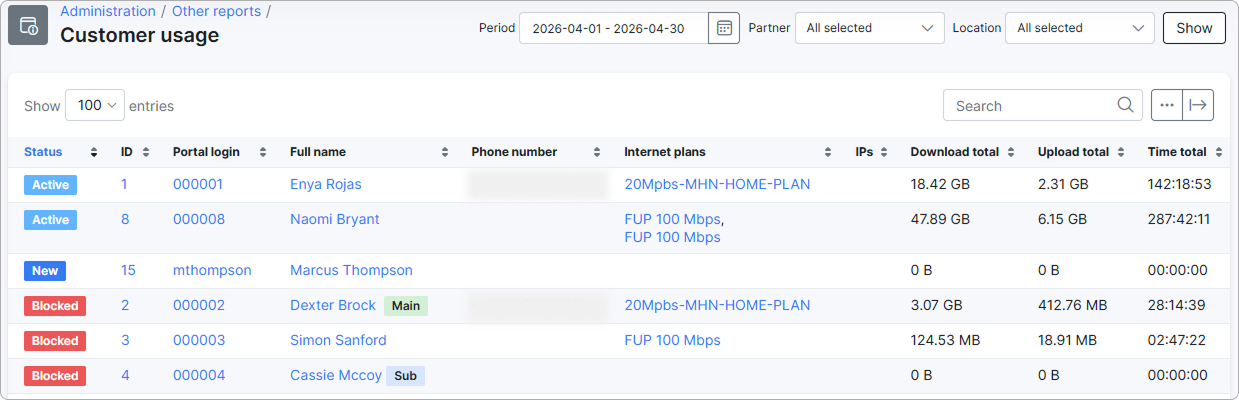
For every customer that matches the chosen filters it shows totals for the selected period:
- Download total and Upload total — bytes transferred during the period.
- Time total — accumulated session time during the period (HH:MM:SS).
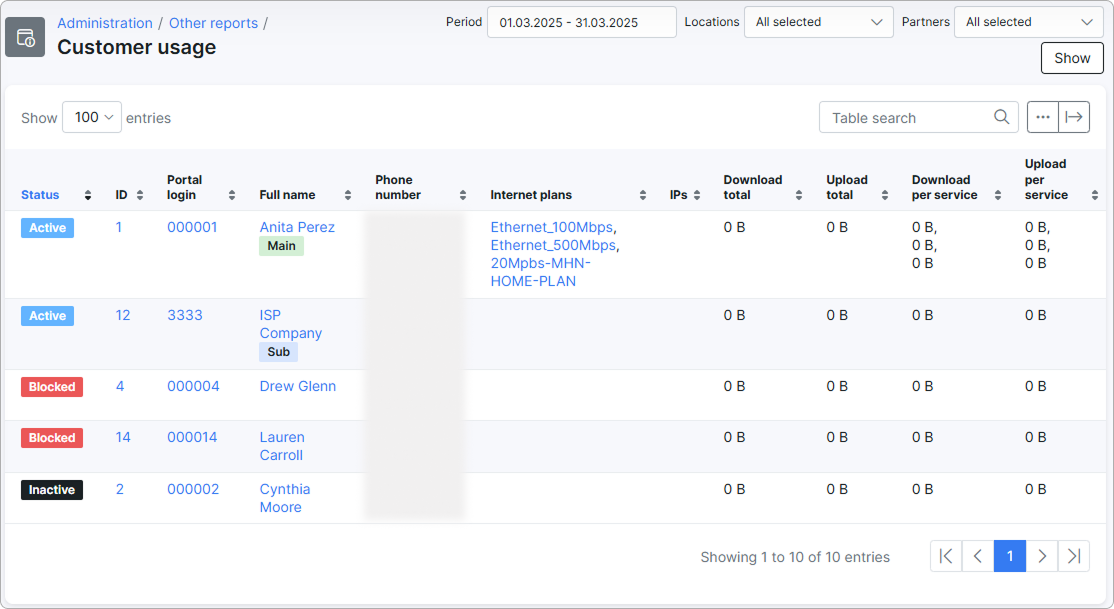
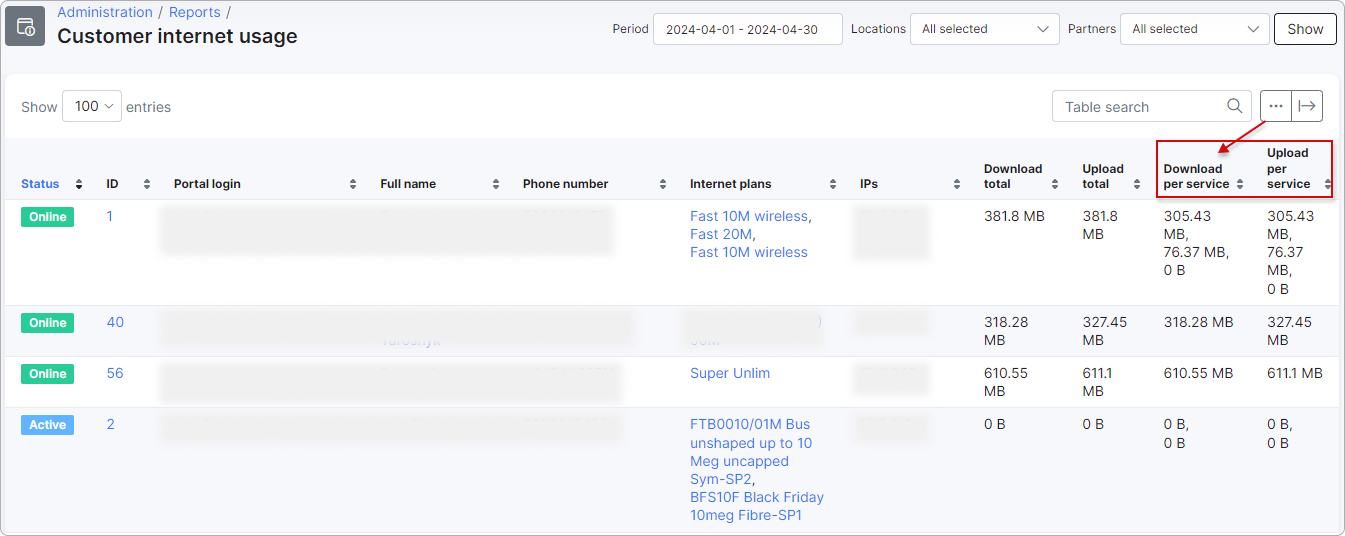
Optional columns split each total per individual internet service so you can see which service contributed how much to the customer's totals.
Because the report can scan a large number of customers, it runs as a background job. After you press Show, the page polls the server until the job finishes and the table is populated. Large date ranges or large customer bases may take several minutes; the Show button stays disabled until the previous run finishes.
Access is restricted. Super Administrators see all customers. Partner administrators see only customers belonging to their own partner.
¶ Filters
Filters narrow the customer set and the time window.
They do not auto-apply — set them and press Show to (re)run the report:
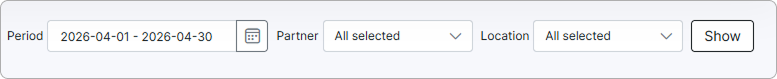
- Period — date range used for both traffic and time aggregation. Supports preset ranges (e.g. This month, Last month) and a custom date range. The range is inclusive on both ends. Default: the current month (1st of the month through today).
- Partner — limits customers to one or more selected partners. Partner administrators are forced to their own partner and cannot change this filter. Default: All selected.
- Location — limits customers to one or more selected locations. Default: All selected.
¶ Table
Each row in the table represents one customer. The table can be sorted by any column header, searched with the Search box, and paginated with the page-size selector at the top.
¶ Default columns
| Column | Description |
|---|---|
| Status | Customer status (Active, Blocked, New, Inactive). |
| ID | Internal customer ID — links to the customer's profile. |
| Portal login | The customer's Customer Portal login. |
| Full name | Customer's full name. For Linked Accounts, a Main or Sub badge appears next to the name. |
| Phone number | Customer's primary phone. |
| Internet plans | The customer's internet plans active in the period — comma-separated when there is more than one. |
| IPs | IP addresses currently assigned to the customer's internet services. |
| Download total | Bytes downloaded by the customer across all internet services in the selected period. |
| Upload total | Bytes uploaded by the customer across all internet services in the selected period. |
| Time total | Accumulated online session time across all internet services in the selected period (formatted as HH:MM:SS). |
Bytes are formatted using the system size formatter (B / KB / MB / GB / TB). Time is formatted from raw seconds into HH:MM:SS.
¶ Optional columns
The table includes many additional columns hidden by default. Enable them through the column visibility menu (see Export and column management). The most relevant ones for usage analysis:
- Download per service — Download total split per internet service. Entries are separated by
;and sorted by value. - Upload per service — Upload total split per internet service.
- Time per service — Time total split per internet service.
Other optional columns let you add identification, billing, address, prepaid, top-up, and service-date fields to the same row — useful when exporting a single CSV that combines usage data with customer billing context.
¶ How values are calculated
The report combines two sources of data: traffic counters and session statistics. Both are populated by the standard Splynx accounting pipeline (Radius / NAS feedback). If a NAS does not send accounting data, or a customer's sessions are not Radius-driven, the corresponding rows show zero — the customer is still listed but with empty usage.
¶ Download and Upload (totals and per service)
For each customer in scope, the report:
- Collects daily traffic counters logged for every internet service of the customer.
- Includes traffic counted against bonus / off-peak buckets (so bonus traffic is not lost).
- Keeps only the days that fall inside the selected period (inclusive on both ends).
- Sums upload bytes and download bytes per service. The per-service value is shown in Download per service / Upload per service.
- Sums all services together for the customer-level totals shown in Download total / Upload total.
Internally, counters are stored in kilobits and converted to bytes for display.
¶ Time (total and per service)
For each customer in scope, the report:
- Collects all Radius accounting sessions belonging to the customer's internet services.
- Keeps only sessions where both the start and the end fall within the selected period — sessions that started before the period or ended after it are excluded.
- Calculates each session's duration as
end − startin seconds. Negative results are treated as zero. - Sums per service for Time per service, and across all services for Time total.
Sessions that span the period boundary are not counted at all. Picking a wider range avoids missing long-running sessions.
¶ Customer scope
A customer is included in the report when they match the Partner and Location filters, regardless of whether they have any internet service or any activity in the period. Customers without traffic or sessions appear with zero values rather than being hidden, so the report can also be used as a customer list with a usage column attached.
¶ Export and column management
Use the export button  at the top right of the table to export the current view in any of these formats:
- Print — opens a printer-friendly view.
- Copy — copies the table to the clipboard.
- Excel — XLSX export.
- CSV — CSV export.
- PDF — printable PDF.
Use the show/hide columns button  to choose which columns are visible and reorder them. Toggle columns on or off with the checkboxes and drag rows to change the column order:
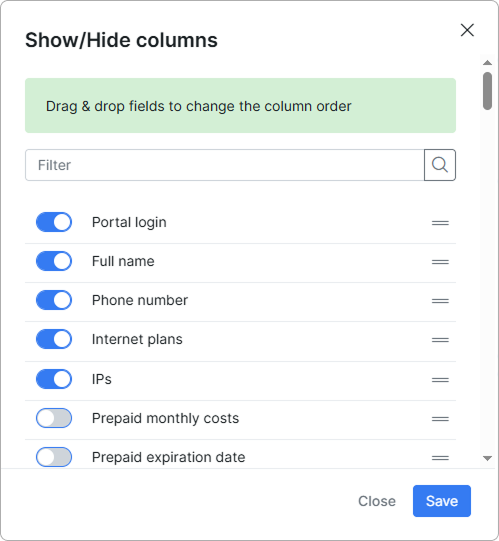
The chosen layout is remembered for the current administrator.
¶ Examples
Find heavy users for last month. Set Period to Last month, leave Partner and Location at All selected, press Show, and sort the table by Download total descending. The top rows are the customers who consumed the most traffic.
Audit a single tariff plan. Use the Search box to filter by plan name (e.g. FUP 100 Mbps). Combine with Period = This month and the Download per service / Time per service columns enabled to see which services on each customer drove most of the usage.
Investigate a quiet customer. Open the report for a longer period (e.g. the last three months), search for the customer's login, and check whether Time total is 00:00:00. If it is, the customer's sessions are not reaching Splynx — usually a sign of missing Radius accounting from the NAS.
¶ Important notes
- The report covers the selected period only; values are not running totals. To compare months, run the report once per month.
- Per-service columns are hidden by default. Enable them in the column visibility menu when you need to see which service contributed most to a customer's totals.
- Bonus / off-peak traffic is included in Download total and Upload total alongside regular traffic.
- Numbers depend entirely on the underlying accounting data. Missing daily traffic rows (e.g. NAS not sending Netflow / counters) or missing session rows (no Radius accounting) produce zeros even though the customer was active.
- Partner and Location filters narrow the customer set, not the data — a customer is either fully included or fully excluded.