¶ NetFlow accounting
¶ Overview
In Splynx NetFlow accounting provides ability to record and process customer traffic statistics that was collected from NetFlow exporters, more specifically - from NAS devices added as Routers to Splynx.
Splynx supports 5th version of NetFlow protocol data to calculate statistic information of ICMP,UDP and TCP packets that passed through your network and was and exported by your NAS device.
Once Router is added and NetFlow accounting is chosen for your NAS in Networking → Routers - Splynx will be open to receive and process NetFlow data from this device via 9995/UDP port by default (can be changed in settings).
Depending on the data received from Router, Splynx is able to mark customer sessions as online and display amount of collected traffic for the session.
¶ Example of MikroTik RouterOS configuration
On MikroTik devices there is an ability to configure router as NetFlow exporter by configuring Traffic Flow.
Step 1:
In Splynx, navigate to Networking → Routers, press Add, specify the router IP and Accounting type:
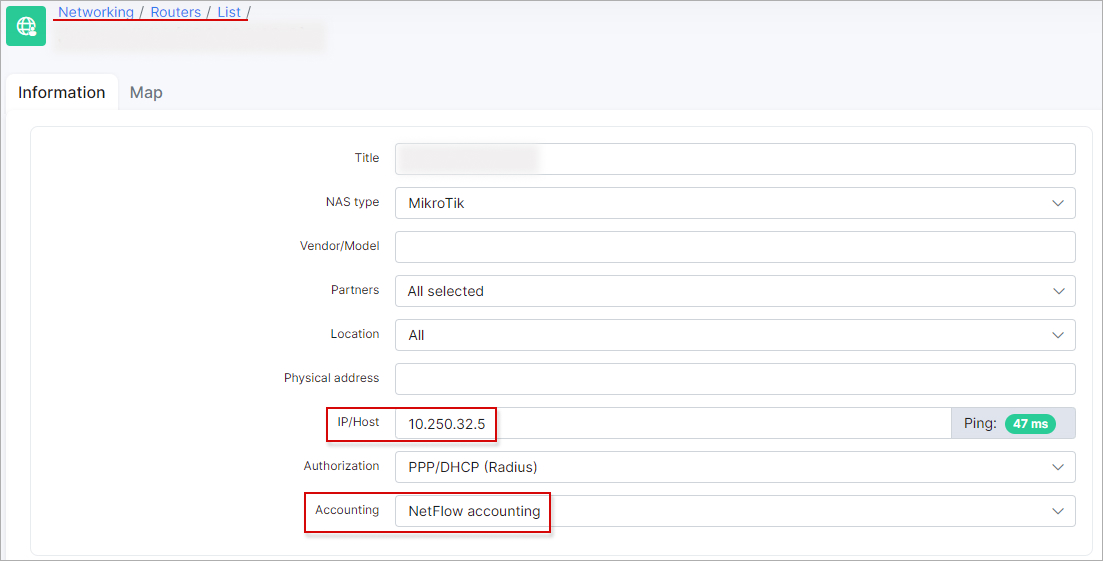
NetFlow accounting will only work if the SRC IP in NetFlow packets originating from router is the same as IP/Host field value on router's info Splynx page, it will not work if router's outgoing traffic is translated (NAT) to IP that is different from what is entered in IP/Host field. It's better to connect your router with built-in OpenVPN feature for NAS and Splynx to be in the same network.
Step 2:
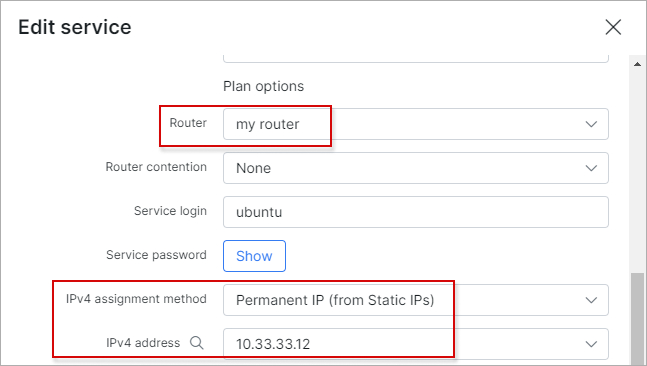
Go to Customers → List, open the necessary customer's profile, click on the Services tab and open the window to edit their Internet service. Specify the router that this service is connected to, the IP assignment method (pool or static) and the IP address:
Step 3:
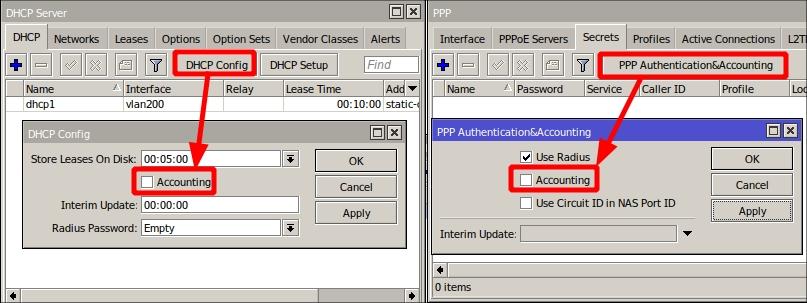
If we use Radius on our router to authorize customers, we should disable Radius accounting for services that must be counted by NetFlow:
-
On the MikroTik device, navigate to
IP → DHCP Server → DHCP (tab) → DHCP Configand disable theAccountingoption; -
Open
PPP → Secrets (tab) → PPP Authentication & Accountingand disable theAccountingoption there:
- Navigate to
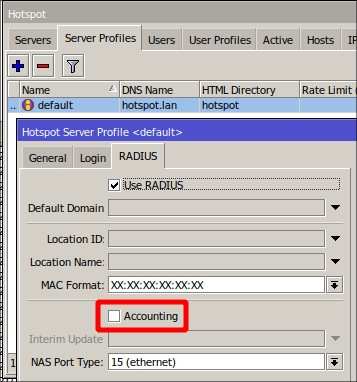
IP → Hotspot, click on the Server Profiles tab, choose your profile and disable theAccountingoption:
Step 4:
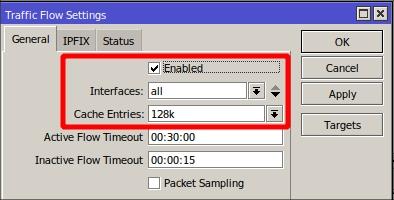
On the MikroTik device, navigate to IP → Traffic Flow, put the check-mark to enable the setting and set the value in the Cache Entries field. Make sure this value is at least 128k, you can increase this value, but this depends on the amount of built-in RAM of the router.
Step 5:
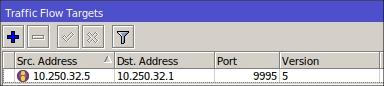
On the MikroTik device, in the Traffic Flow Settings window, click on the Targets button and add Splynx as the traffic flow target:
- add your Splynx IP address to the Dst. Address and type your router IP address to the Src. Address, specify the Port value, it should be
9995and select the Version value -5.
Step 6:
Once the Traffic Flow is enabled on MikroTik router, please wait 5-10 minutes for traffic to appear.
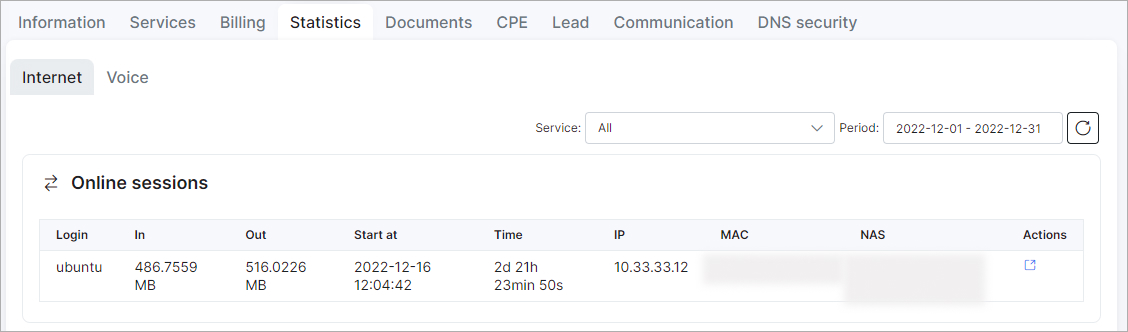
The traffic should be counted from the first finished flow that MikroTik sent to the Splynx nfcapd collector:
¶ Splynx Configuration Overview
In Config → Networking → NetFlow accounting we can change its Daemon and Expire options:
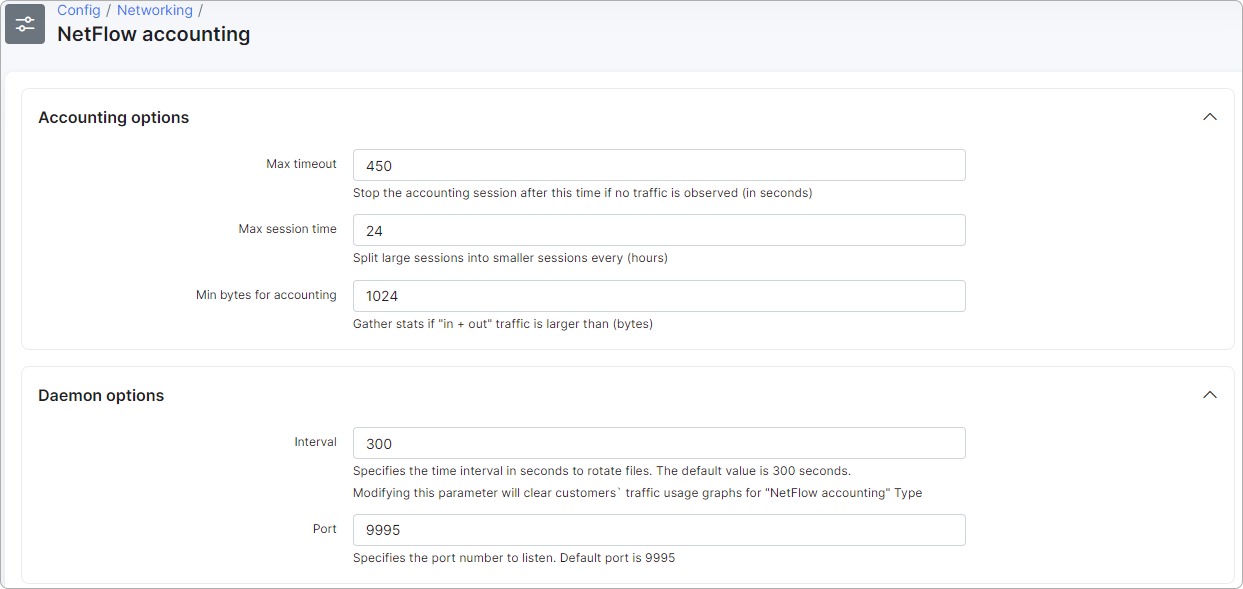
| Accounting options: | |
| Max timeout | Time in seconds when the accounting of the session will be stopped if there is no traffic. The default value is 450 seconds. |
| Max session time | Time in hours when large sessions will be spitted into smaller ones in the statistics. The default value is 24 hours. |
| Min bytes for accounting | if the accounting package shows that the used traffic is less than the indicated value (1024 bytes by default), such a package will be declined. |
| Daemon options: | |
| Interval | Specifies the time interval in seconds to rotate files. The default value is 300 seconds. |
| Port | Specifies the port number to listen. Default port is 9995. |
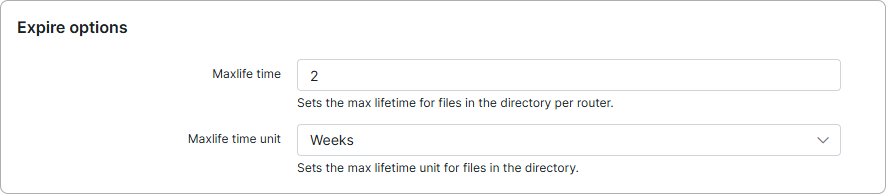
| Expire options: | |
| Maxlife time | Sets the max lifetime for files in the directory. The supplied maxlife_time accepts values such as 31d, 240H 1.5d etc. Accepted time scales are w (weeks) d (days) H (hours). |
¶ Troubleshooting
 Check the daemon state and log data
Splynx uses some scripts from the nfdump package to calculate traffic. The daemon nfcapd listens to the port and the data can be received there.
When the interval for data collection ends, the data will be written to a file. After that the console script ./var/www/splynx/system/scripts/accounting-netflow is started, it runs nfdump process with the specific parameters, script gets a response and converts it in the acceptable format for Splynx Accounting Processor.
To check if the nfcapd daemon is running:
ps -aux | grep nfcapd
Log of nfcapd daemon is written to syslog:
sudo tail -f /var/log/syslog | grep nfcapd
Review collected traffic via CLI
nfcapd is configured to save collected traffic to /tmp/nfcapd/ folder. For each router there is subfolder named router_ with corresponding number value at the end that is ID of the router in Splynx.
To display all present collected data from router with ID:1 and service with IP 192.168.1.25 you can use the following command:
nfdump 'host 192.168.1.25' -R /tmp/nfcapd/router_1/ -A proto,srcip,dstip,srcport,dstport -O bytes
You can add -t key to display collected flows of specific time period, for example from 2023/01/25 to 2023/01/26:
nfdump 'host 192.168.1.25' -t 2023/01/25.00:00:00-2023/01/26.00:00:00 -R /tmp/nfcapd/router_1/ -A proto,srcip,dstip,srcport,dstport -O bytes
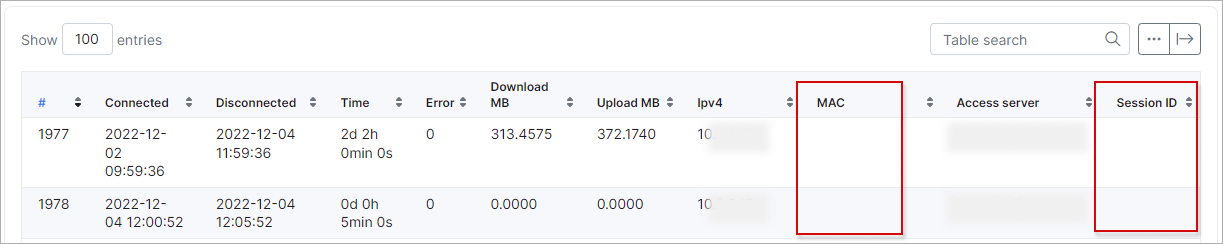
Missing of MAC and Session ID values in the customer's Internet statistics
In the customer's Internet sessions statistics you can notice that the last two sessions are listed without MAC and Session ID values. This is a common condition due to a limitation in 5th version of NetFlow, which results in such data not being passed to Splynx.