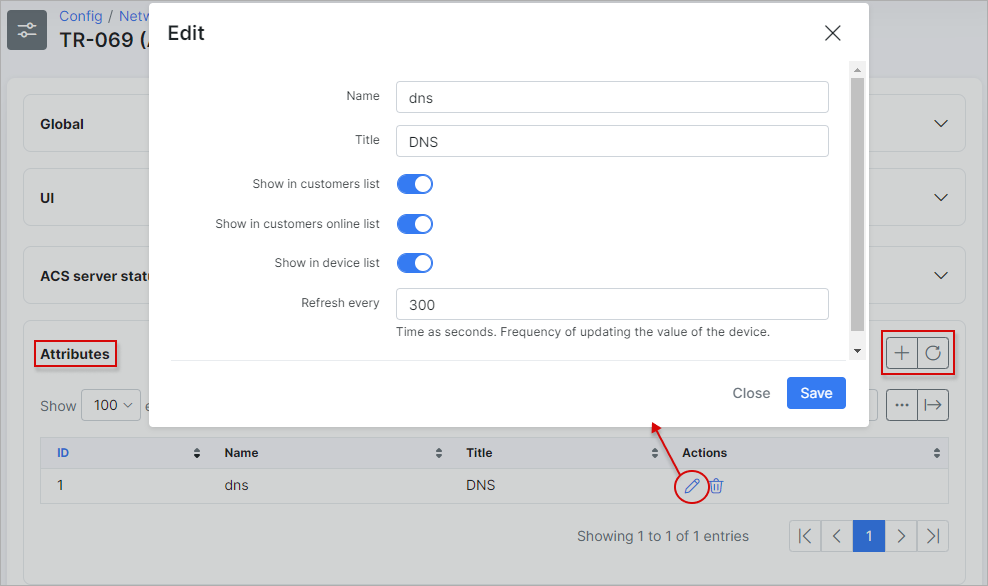
Here we can add the custom attributes to be displayed under ACS devices in Splynx. For example, we need to display a DNS attribute on the main info of device:
Once the attribute is added, you need to connect some devices to proceed with its configuration.
You will be able to display all these attributes:
Once some devices are added and you have groups available, click on Attributes config near some group:
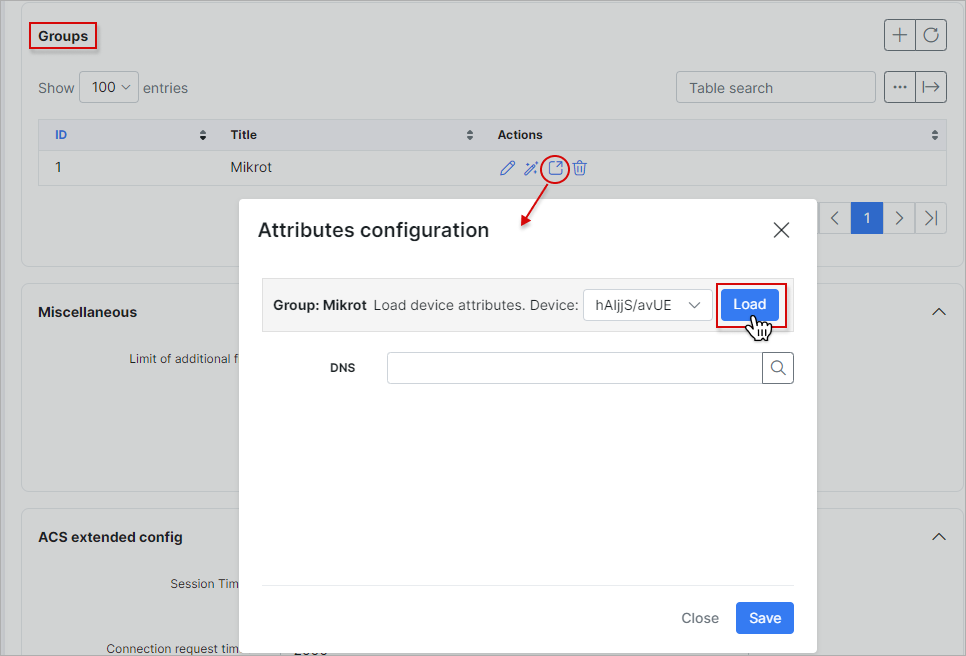
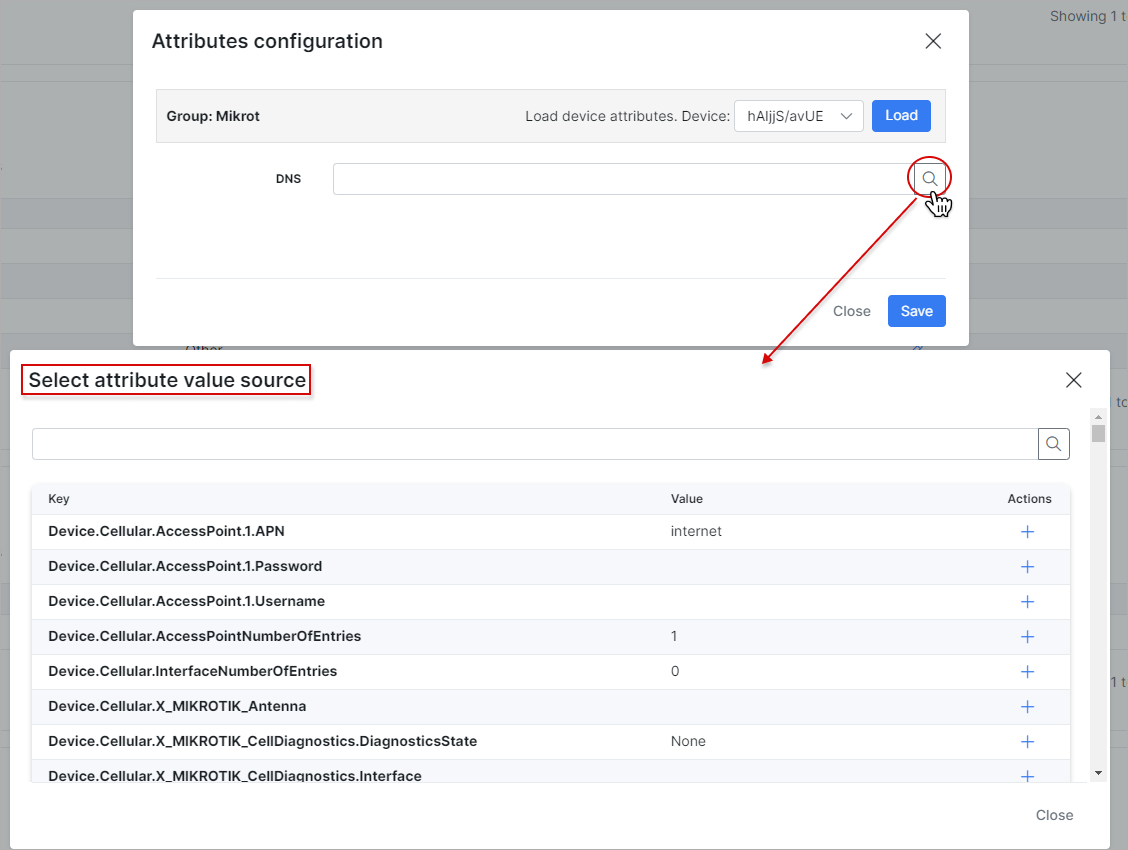
Select a device and click on Load button to load attributes. After the load, the attributes are ready to use:
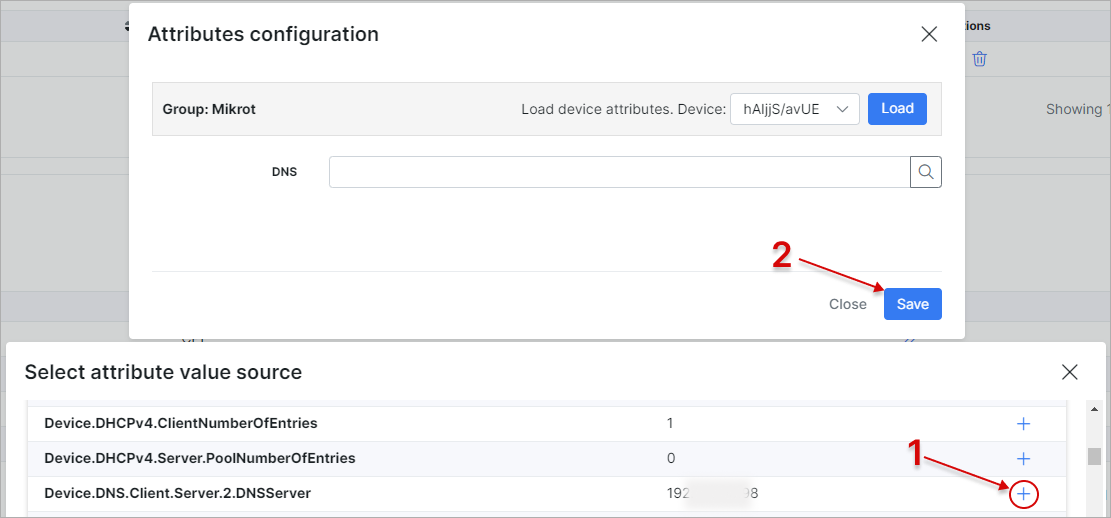
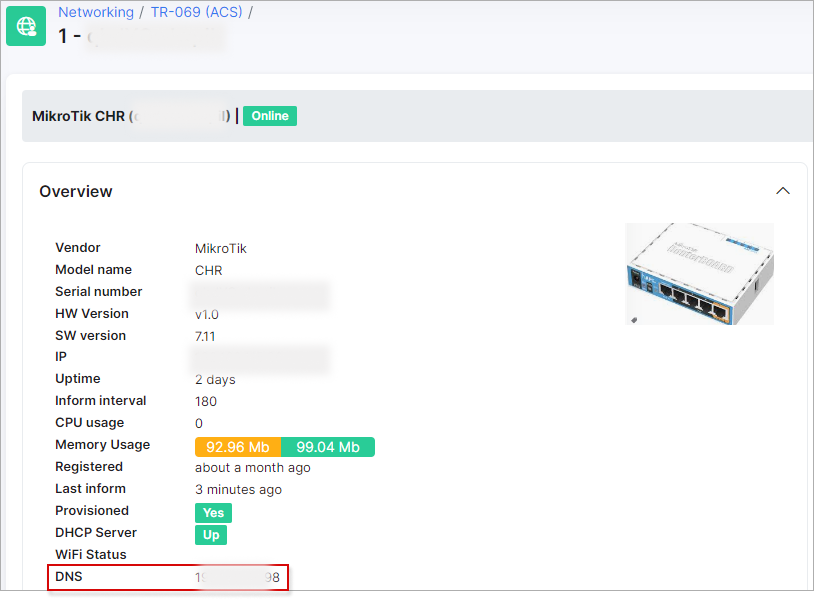
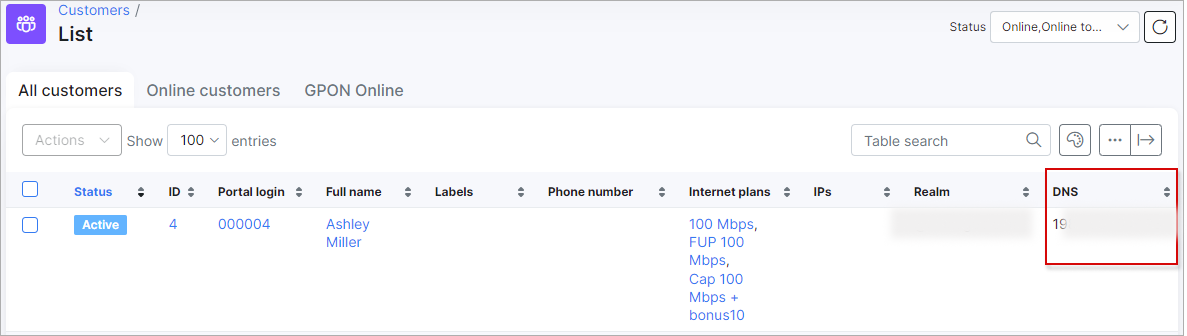
and after its configuration you'll see the attribute values on the device overview or in customers list:
Additionally, in device control menu we can find the following sections:
On the Overview tab you can see basic parameters like uptime, IP, CPU usage etc.
On the Relation tab you can set type of device (type should be created under Config → Networking → TR-069 → Types
), group (should be created under Config → Networking → TR-069 → Groups
as well) also the customer and their services can be linked to this device.
On Tasks tab you will see the pending tasks (like you run a wi-fi password change and task will be created).
On Faults tab you will see tasks what were executed with an errors.
When click on Actions button you can find next options:
At the bottom of the page there are additional tabs related to the router: WAN, LAN, NAT, FIREWALL, DIAGNOSES, ACTIVITY:
Switch between available tabs to configure needed parameters. As an example we can change a DHCP server parameters:
or add some firewall rules right here:
On Diagnostic tab you can find such diagnostic tools as: ping, traceroute, upload/download statistic and wifi-analyzer:
To run some diagnostic tool click on Run button near each tool.
NOTE!: This menu can differ depending on a device, e.g. Mikrotik router can be without а Wi-Fi module.
Wi-fi analyzer shows all the available wi-fi networks and its signal strength.
Debug logs can be found under Administration → Logs → [Files](administration/logs/files/files.md)
and find files by word genie
: