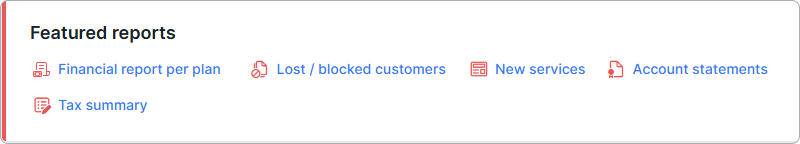
¶ Lost / blocked customers
- Overview
- Filters
- Chart
- Table
- How values are calculated
- Practical reading guide
- Important notes
- Related pages
¶ Overview
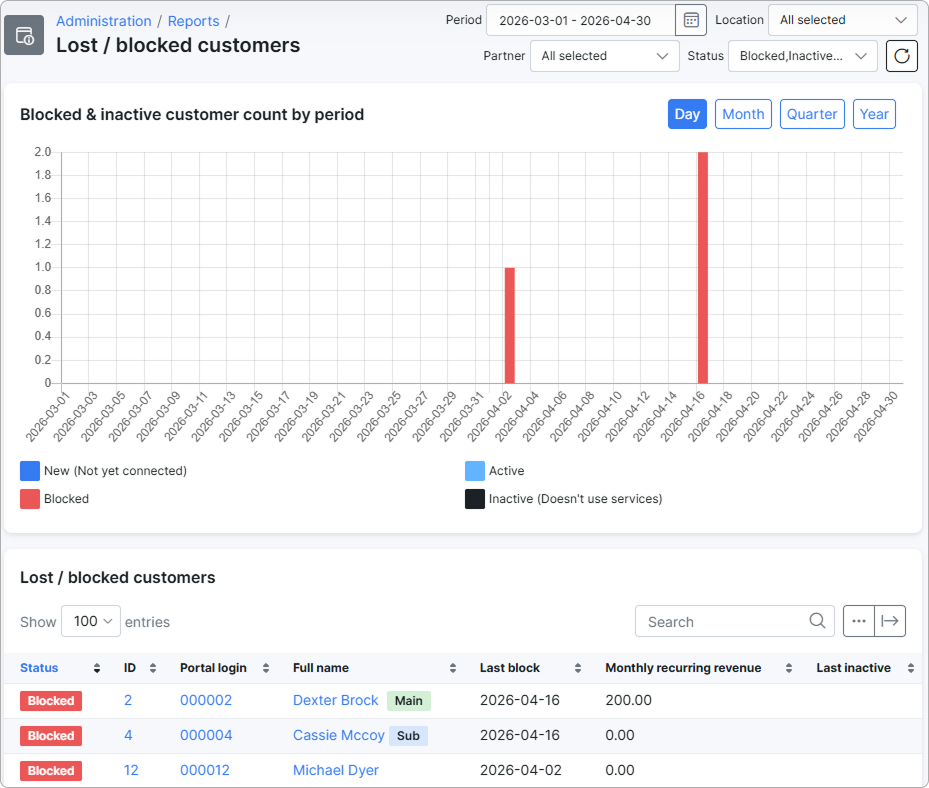
The Lost / blocked customers report shows every customer whose status changed to Blocked or Inactive (Doesn't use services) at any point during a selected period, together with the monthly recurring revenue (MRR) each customer represented on the day they were blocked. It helps you measure churn and at-risk revenue in one view.
To find the report, navigate to Administration → Reports → Lost / blocked customers:
The report answers two questions for an ISP administrator:
- How many customers did I lose (or risk losing) in this period? — counted on the chart.
- How much recurring revenue did those customers represent? — listed in the table next to each customer, using the MRR they had on the day of their last block.
A customer appears in the report if their status changed to Blocked or Inactive (Doesn't use services) at least once inside the selected period — even if they were unblocked or reactivated afterwards.
The page has two sections driven by the same filter and the same set of customers:
- A stacked bar chart at the top — counts of blocked / inactive customers over time.
- A table below — one row per customer, with the date of the last block and the MRR at that moment.
Access to this report is restricted to users with the Super administrator role.
¶ Filters
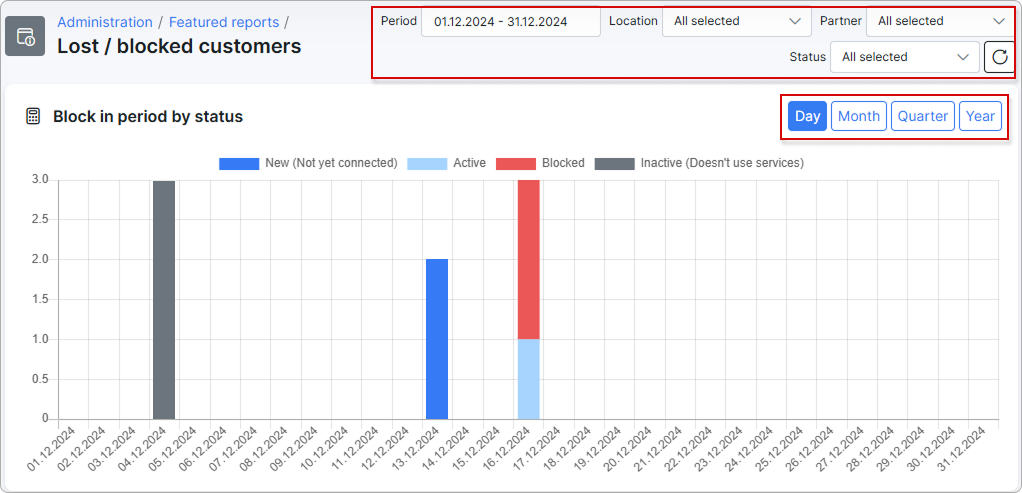
The filter row at the top of the page controls both the chart and the table.

- Period — the date range to inspect. The report finds every status change to Blocked or Inactive (Doesn't use services) whose timestamp falls inside this range. Defaults to the current month. Presets are available for Today, Yesterday, Last 7 days, Last 30 days, This month, Last month, and Custom range.
- Location — restricts the report to customers currently assigned to the selected location(s). Defaults to all locations.
- Partner — restricts the report to customers currently belonging to the selected partner(s). Defaults to all partners.
- Status — restricts the chart and table to customers whose current status is in the chosen list. Options: New (Not yet connected), Active, Blocked, Inactive (Doesn't use services). Defaults to Blocked and Inactive (Doesn't use services).
Click the Refresh button to reload the data with the current filter values.
The Status, Location, and Partner filters use each customer's current values — not the values they had at the moment of the block. A customer who was on Partner A when blocked and later moved to Partner B is filtered as Partner B. The Period filter, by contrast, is applied to the timestamp of the status change itself.
¶ Chart
The chart is titled Blocked & inactive customer count by period and is a stacked bar chart.
- X-axis — time, grouped by Day, Month, Quarter, or Year. Use the buttons in the chart header to switch the grouping. The buckets cover exactly the selected period.
- Y-axis — number of customers.
- Each customer is counted once, in the bucket that contains the date of their most recent block or inactive transition within the period.
- Stack segments are colored by each customer's current status (not the status they were moved to at block time):
- New (Not yet connected) — blue
- Active — light blue
- Blocked — red
- Inactive (Doesn't use services) — dark
- Click an entry in the legend to hide or show the corresponding segment.
¶ Why a customer can appear with status Active or New in the chart
The chart is built from the same base set of customers as the table — every customer who was blocked or marked inactive at some point inside the selected period — but the bars are stacked by current status. The Active segments effectively show recovered customers (blocked during the period but reactivated since), and the Blocked and Inactive (Doesn't use services) segments show those who are still lost.
To see only customers who are still blocked or inactive now, leave the Status filter at its default (Blocked + Inactive (Doesn't use services)). With this default, the chart contains only those two segments.
¶ Table
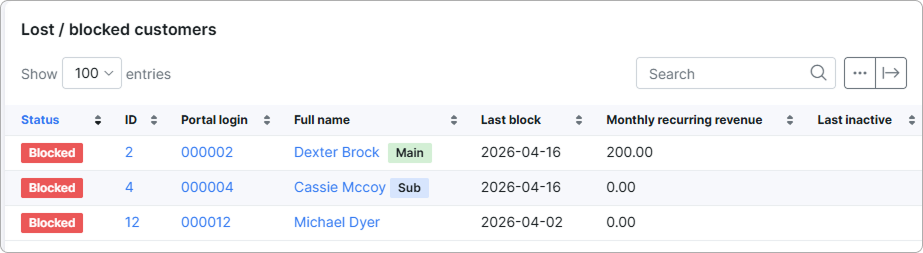
The table is titled Lost / blocked customers and contains one row per customer that matches the filter.
Default columns:
| Column | Description |
|---|---|
| Status | The customer's current status, shown as a colored badge. |
| ID | The customer's internal numeric ID. Click to open the customer card. |
| Portal login | The customer's Customer Portal login. Click to open the customer card. |
| Full name | The customer's full name. For customers in a Linked Accounts group, a Main or Sub badge is shown next to the name. |
| Last block | Date of the most recent change into Blocked or Inactive (Doesn't use services) within the selected period — the same date the chart uses for stacking. |
| Monthly recurring revenue | The customer's MRR snapshot on the day of the last block. Represents the recurring revenue you stopped collecting at that point. |
| Last inactive | Date of the most recent change specifically to Inactive (Doesn't use services) within the period. Empty if the customer was only blocked (not marked inactive) in this window. |
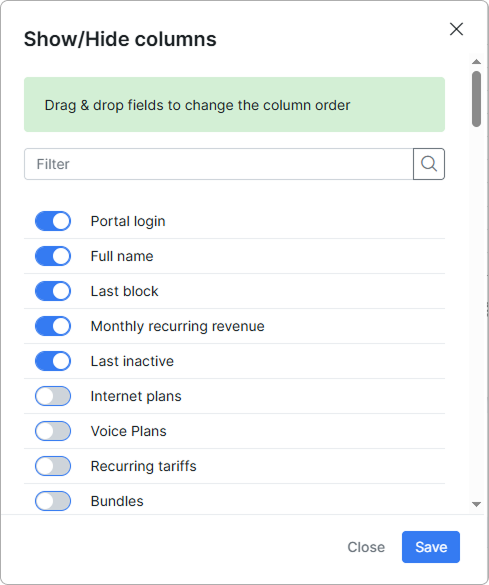
The table supports the standard Splynx datatable features: search, sort, page size selection, and pagination. Use the column-toggle button above the table to add or remove additional columns from Customer info, Customer billing, and Customer CAP settings — the column dialog also supports drag-and-drop reordering.
Use the export button  to export the current table view as Print, Copy, Excel, CSV, or PDF.
¶ How values are calculated
¶ Where the data comes from
The report draws on three sources:
- The audit history of customer status changes. Every time a customer's status changes (for example, Active → Blocked), Splynx records the old status, the new status, and the date of the change. This audit log is the basis of the report.
- The customer record. Used to read the customer's current status, location, partner, name, and login.
- Daily MRR snapshots. Splynx calculates each customer's MRR once a day and stores one value per customer per day. The report reads the snapshot for the exact date of each customer's last block to show how much MRR they represented at that moment.
Additional columns added to the table through the column-toggle dialog draw their values from Customer info, Customer billing, and Customer CAP settings.
¶ Which customers appear in the report
For each customer, the report:
- Looks at the audit history of status changes and finds the most recent transition into Blocked or Inactive (Doesn't use services) whose timestamp falls inside the selected Period.
- If such a transition exists, the customer is included in the report.
- The Location, Partner, and Status filters then narrow the list further by the customer's current attributes.
Both manual status changes (made by an administrator) and automatic ones (such as auto-block by overdue invoice) are recorded the same way and both appear in the report — the report does not distinguish between them.
¶ Last block
The date of the most recent change of the customer's status into Blocked or Inactive (Doesn't use services) within the selected period. If a customer was blocked twice in the period, only the later date is shown.
¶ Last inactive
The date of the most recent change specifically into Inactive (Doesn't use services) within the period. This is empty when the customer was only blocked (and not also marked inactive) inside the window.
¶ Monthly recurring revenue
The report reads the daily MRR snapshot for the exact date of the customer's last block (the value shown in the Last block column) and displays it in the Monthly recurring revenue column. This is the recurring revenue the customer represented on the day they were blocked.
If the customer had no chargeable services on the day of the block — for example, customers whose services were already removed before they were marked Inactive (Doesn't use services) — the Monthly recurring revenue column shows 0.00.
¶ Chart bucket counts
For each time bucket on the chart (a day, month, quarter, or year, depending on the grouping):
- The report collects every customer whose Last block date falls inside that bucket.
- It groups them by their current status.
- It counts each customer once and stacks the counts in the bar.
A single customer is therefore never counted twice — they always land in exactly one bucket and one stack segment per chart view.
¶ Practical reading guide
- Total bar height per day equals the number of customers who lost service on that day within the filtered scope.
- Sum of red + dark segments across the period gives the customers you have actually lost and not won back.
- Light-blue and blue segments are customers who were temporarily blocked but are Active or New (Not yet connected) again — a rough recovery indicator.
- Sum of the Monthly recurring revenue column in the table is the monetary value of the lost or at-risk recurring revenue for the period, using the MRR each customer had on the day they were blocked.
¶ Important notes
- The Period filter is applied to the timestamp of the status change. Changing the date range can dramatically change which entry is shown in the Last block column — it is the latest block within the chosen period, not the customer's all-time last block.
- The Status, Location, and Partner filters use the customer's current attributes. A customer whose location or partner changed after they were blocked is filtered by the new values.
- Manual and automatic status changes are not distinguished in the report.
- A Monthly recurring revenue of 0.00 means the customer had no chargeable services on the day of the block. This is common for customers in the Inactive (Doesn't use services) status, who typically no longer have any active services.