¶ Plan usage
- Overview
- Where to find the report
- Filters
- Data source: Counters vs Sessions
- Table
- How values are calculated
- Sorting and exporting
- Examples
- Important notes
- Related pages
¶ Overview
This report shows how much internet traffic was consumed during a chosen period, broken down by Internet plan and by partner. Use it to see which plans your customers load most heavily, and how that load splits across partners and locations.
The Plan usage report aggregates download and upload volume for Internet services and groups the result by plan + partner. It answers questions like:
- Which Internet plans generated the most traffic last month?
- How is traffic distributed between partners?
- How many active services on a given plan actually produced traffic in the period?
The result is presented as a single sortable table — there is no chart on this page.
¶ Where to find the report
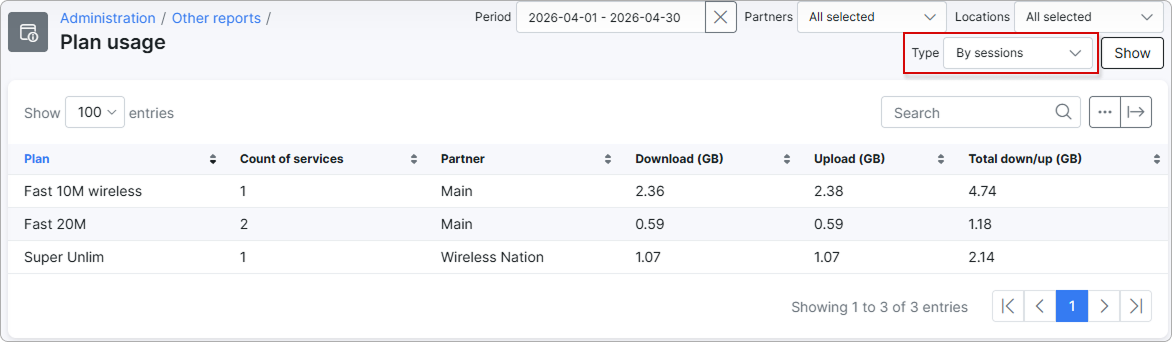
Navigate to Administration → Other reports → Plan usage.
The breadcrumb at the top of the page is Administration → Other reports → Plan usage, and the URL ends in /administration/reports/statistics-internet.
Only administrators with the Super-administrator role can open this report. The Plan usage link does not appear in Other reports for any other role.
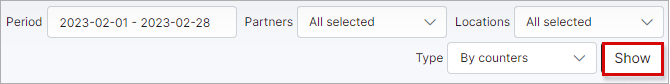
¶ Filters
The filter bar at the top of the page controls which data is included in the table. After changing any filter, click Show to re-run the report.
- Period — date range the report covers. Defaults to the current month (1st of the month → last day of the month). Click the field to open a calendar with quick presets: Today, Yesterday, Last 7 days, Last 30 days, This month, Last month, or Custom range.
- Partners — multi-select list of partners. Defaults to all partners. If your administrator account is bound to a specific partner, the report shows only that partner's data, regardless of what you select here — your account's partner overrides the filter.
- Locations — multi-select list of locations. Defaults to all locations. The location filter applies to the customer owning each service — only services belonging to non-deleted customers in the chosen location(s) are counted.
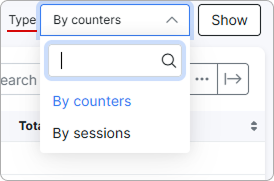
- Type — chooses the data source the report reads from. Options are By counters (default) and By sessions. The choice can change the resulting numbers — see the next section.
¶ Data source: Counters vs Sessions
The Type filter is the most important setting on this report — it determines where the traffic figures come from. The two modes can produce meaningfully different totals for the same period.
¶ By counters (default)
Reads from the daily per-service traffic counters that Splynx collects from your network equipment (RADIUS, Mikrotik, NetFlow, and similar — depending on how your accounting is set up).
- The report counts only dates that fall inside the selected period.
- Each service is grouped by its current partner and current Internet plan. If a service has been moved between plans or partners, its historical traffic is shown under the partner and plan it has now.
- Best when you want a clean daily traffic total per service, matched to where that service sits today.
¶ By sessions
Reads directly from raw session records (one row per RADIUS or accounting session, as registered by the access server).
- A session is included if its start date falls inside the selected period — even if the session continued past the end of the period.
- Each session is grouped by the partner and Internet plan that were recorded on the session itself at the time it ran. If a service was later moved to a different plan or partner, the old sessions stay under the old plan and partner — they are not "rewritten".
- Best when you want to see traffic exactly as the access server saw it, including sessions of customers or services that have since been edited or deleted.
The two modes can show different totals for the same period. Sessions can span midnight and be counted under their start date, daily counters can be re-aggregated or post-processed, and historical migrations are handled differently in each mode. If counters and sessions disagree, neither is "wrong" — they answer slightly different questions.
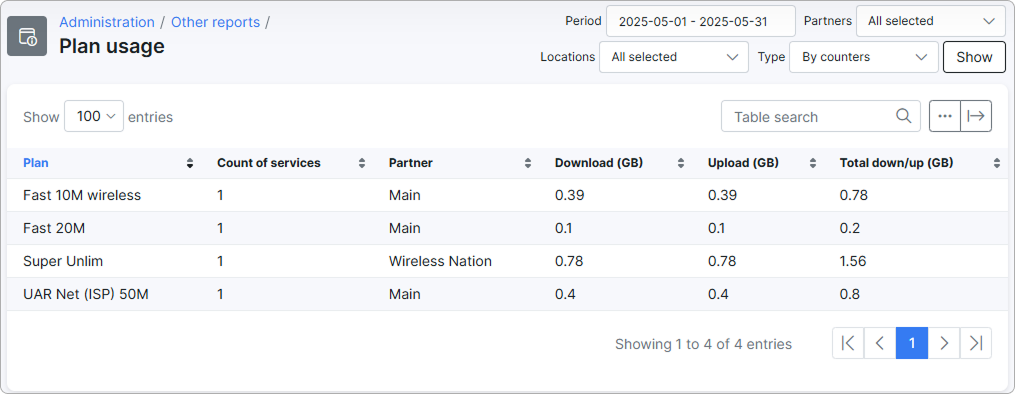
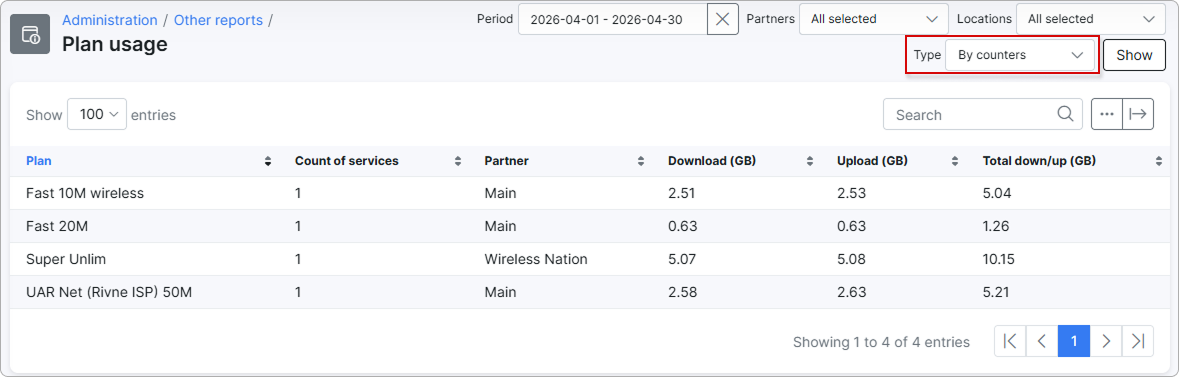
¶ Table
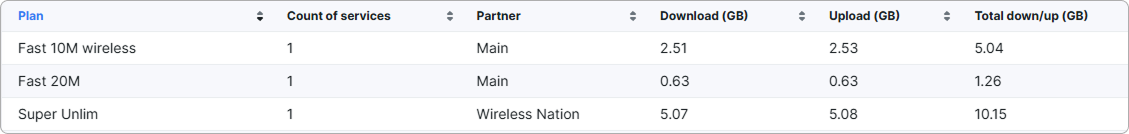
The result is shown in a single table. Each row represents a unique combination of Internet plan + partner that had any traffic in the period. Plans with no traffic in the chosen period and mode do not appear.
| Column | Description |
|---|---|
| Plan | Name of the Internet plan. |
| Count of services | Number of distinct active customer services that produced traffic on this plan during the period. A subscriber who was offline for the whole period is not counted. |
| Partner | Partner the services in this row belong to. In By counters mode this is the customer's current partner; in By sessions mode it is the partner recorded on the session. |
| Download (GB) | Total download volume for all services in this row over the period, in gigabytes. |
| Upload (GB) | Total upload volume for all services in this row over the period, in gigabytes. |
| Total down/up (GB) | Sum of Download (GB) and Upload (GB) for the row. |
There is no totals row at the bottom of the table — totals per partner or per location must be summed manually from the visible rows.
¶ How values are calculated
Each row in the table is a Plan + Partner group. The per-row figures are built as follows.
¶ Count of services
- Splynx collects every Internet service that produced any traffic on this plan and partner during the selected period.
- Each service is counted only once, no matter how many days or sessions of traffic it had.
- Services belonging to deleted customers are excluded.
- Services whose customer is in a location not selected by the Locations filter are excluded.
The result is the number of distinct active services that contributed traffic — not the total number of subscribers on that plan.
¶ Download (GB) and Upload (GB)
- The report collects all traffic records on this plan and partner inside the selected period.
- In By counters mode, this means all daily counters whose date falls in the period.
- In By sessions mode, this means all sessions whose start date falls in the period.
- Records belonging to excluded services (deleted customers, or customers outside the chosen locations) are dropped.
- Incoming bytes (download) and outgoing bytes (upload) are summed separately across all the remaining records.
- Each total is converted into gigabytes for display.
¶ Total down/up (GB)
The sum of Download (GB) and Upload (GB) for the row.
Refunded payments, voided invoices and similar billing-side adjustments do not affect this report — the numbers reflect raw traffic volume only, not money.
¶ Sorting and exporting
- Sorting — click any column header to sort the table by that column. The numeric columns (Download, Upload, Total down/up) sort by the underlying byte value, so 900 MB sorts below 1 GB correctly even though both display in GB.
- Search — the search box above the table filters rows by any visible value (plan name, partner name).
- Show entries — controls how many rows are shown per page.
- Show/hide columns — the first table toolbar icon opens a menu where you can toggle columns on or off.
- Export to — the second toolbar icon opens an export menu with
Print,Copy,Excel,CSVandPDFoptions. The export reflects the current filter, sort and column visibility.

¶ Examples
Month-end traffic check. An administrator wants to see which Internet plans drove the most traffic in March. They set Period to Last month, leave Partners and Locations at all, keep Type at By counters, and click Show. The table lists each plan with its active service count and total traffic. Sorting by Total down/up (GB) descending puts the heaviest plans at the top.
Reviewing a service migration. A customer was moved from Home 100 to Home 500 mid-month. The administrator wants to see the customer's traffic split between the old and new plans for that month. They set Type to By sessions — sessions before the migration appear under Home 100 and sessions after the migration appear under Home 500. Switching back to By counters would instead show all of that customer's traffic for the month under the new plan, Home 500, because counters always group by the plan the service has now.
¶ Important notes
- A plan with zero traffic in the selected period and mode does not appear in the table at all. Absence of a plan does not mean it has no subscribers — only that no service on it produced traffic in this period.
- The Count of services column counts services that produced traffic, not the number of services subscribed to the plan. Customers who were offline for the whole period are invisible to this report.
- In By counters mode, partner and plan are always the current ones for the service. A service moved to a new plan or partner will appear only under the new plan and partner, even for traffic that ran before the move.
- In By sessions mode, partner and plan are the historical values stored on each session. A service moved mid-period can appear in two rows (old and new combinations).
- Each run of the report recomputes results from the database — there is no caching between runs. The filter inputs are temporarily disabled while the report is being generated, and the table is filled in once the calculation finishes.
- This report only deals with traffic. There are no charts on the page and no monetary values.