¶ New services
- Overview
- Filters
- Totals block
- Detail table
- How values are calculated
- Reading Old price and Difference price
- Show/Hide columns and export
- Important notes
- Related pages
¶ Overview
The New services report lists customer services that started during a chosen period and totals their value by service type. Use it to track newly activated revenue — how many new Internet, Voice, Recurring, or Bundle services began, what they are worth, and how much of that revenue came from upgrades of previously pending services.
To open the report, go to Administration → Featured reports → New services.

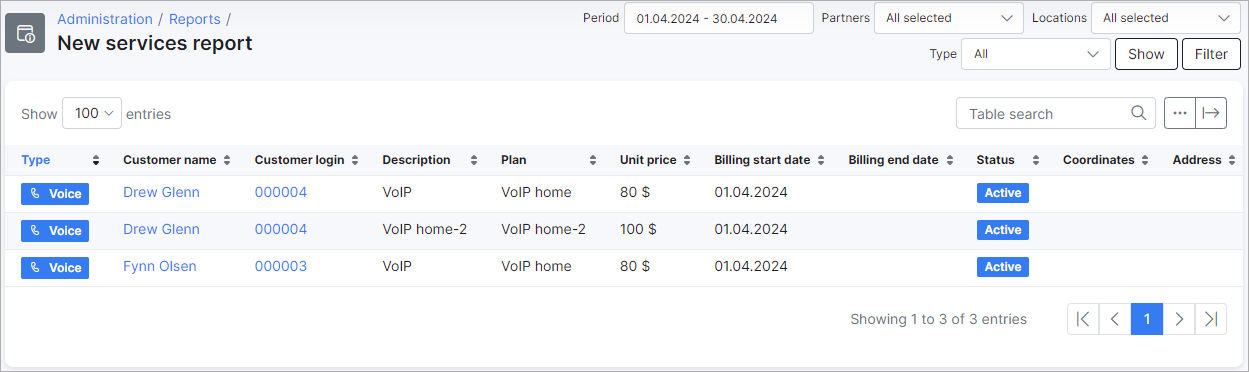
The report opens for the current month by default, with all partners, all locations, and all plan types selected. Press Show to load the data; the report runs as a background task and the page shows Processing… while results are prepared. Once the task finishes, the page displays a Totals summary block followed by a detail table.
¶ Filters
Each filter narrows what data is included in the Totals block and the detail table. After changing filters, press Show to refresh the report.

- Period — date range to include. Defaults to the current calendar month. The report selects services whose billing start date (or, for bundles, contract start date) falls inside this range.
- Partners — restricts results to customers belonging to the selected partners. Defaults to all partners.
- Locations — restricts results to customers belonging to the selected locations. Defaults to all locations.
- Plan type — limits the report to one service type: All, Bundle, Internet, Recurring, or Voice. Defaults to All.
¶ Advanced filters
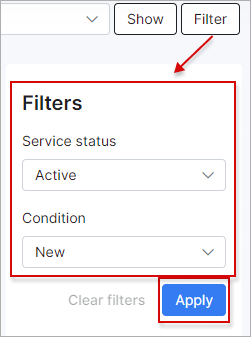
Press the Filter button on the right to open the advanced filter panel. Set values, then press Apply (or Clear filters to reset).
- Service status — filters by current service status: All, Active, Disabled, Stopped, Pending, Paused, or Archived.
- Condition — selects how the service was created:
- All — both conditions below.
- New — first-time service for the customer (no previous service replaced).
- From pending — service that replaced a previously pending one for the same customer (an upgrade or change of plan).
¶ Totals block
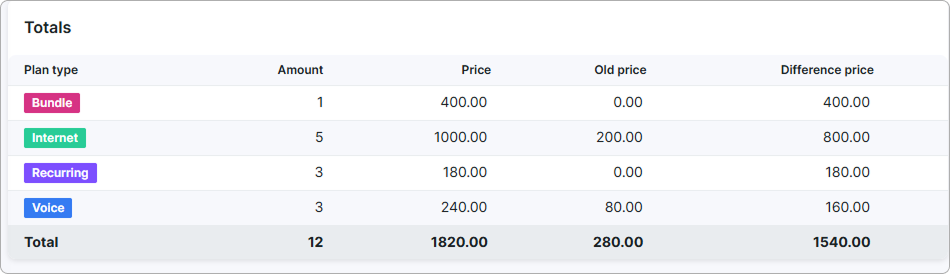
The Totals block at the top of the report summarizes new services grouped by plan type, with a grand total at the bottom. It always lists Bundle, Internet, Recurring, and Voice — types with no matching services show zeros.
| Column | Description |
|---|---|
| Plan type | Service type — Bundle, Internet, Recurring, Voice, or the Total grand row. |
| Amount | Number of services of that type that started in the selected period. |
| Price | Sum of the new services' prices for that type. See How values are calculated. |
| Old price | Sum of the previous services' prices, only for rows whose Condition is From pending. Rows with no previous service contribute 0. |
| Difference price | Price − Old price for that type. Positive values mean the new services brought more revenue than the previous ones; negative values indicate downgrades. |
¶ Detail table
The detail table below the Totals block lists one row per new service.
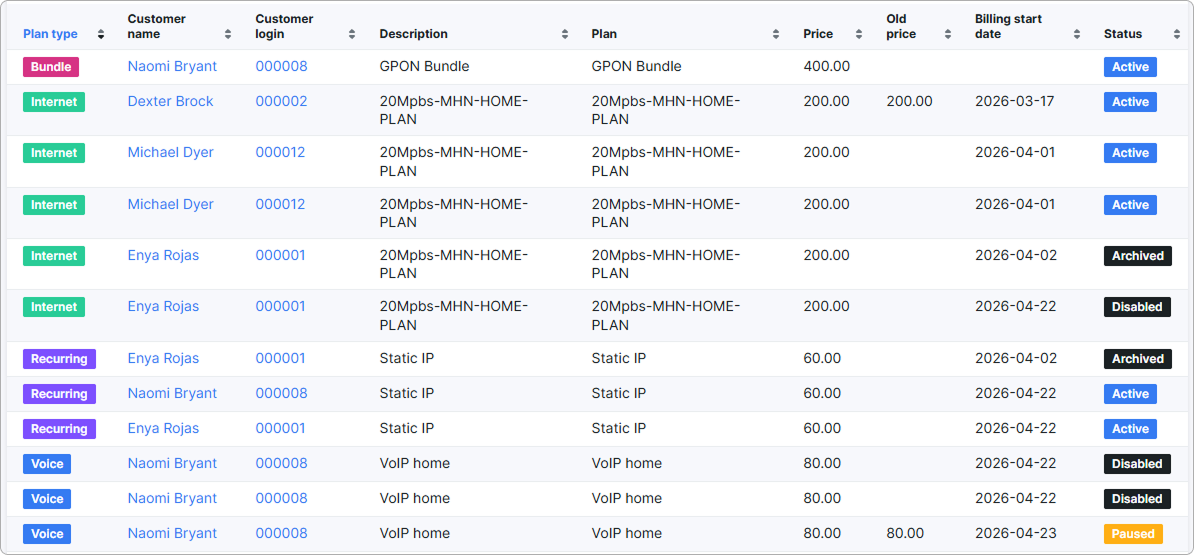
Default columns:
| Column | Description |
|---|---|
| Plan type | Service type, shown as a colored label (Bundle, Internet, Recurring, Voice). |
| Customer name | Full name of the customer the service belongs to. |
| Customer login | Customer's login. Click to open the customer record. |
| Description | Service description as set on the customer's service record. |
| Plan | Tariff plan the service is based on. |
| Price | Current price of the new service. |
| Old price | Price of the previous service, if this row's Condition is From pending. Empty (or 0) for first-time services. |
| Billing start date | Date the service started — the date the report uses to decide whether the service falls inside the selected period. For bundles, this is the contract start date. |
| Status | Current status of the service: Active, Disabled, Stopped, Pending, Paused, or Archived. |
Use the Show dropdown above the table to change how many entries are listed per page (10 / 25 / 50 / 75 / 100), the Search box to filter rows by any visible field, or column headers to sort.
¶ How values are calculated
The numbers in the Totals block come from the same set of services as the detail table — every filter applied to the detail rows also applies to the totals.
¶ Which services count as "new"
A service appears in the report if all of the following are true:
- Its billing start date falls inside the selected Period. For bundles, the contract start date is used instead.
- The service is not deleted.
- The service belongs to a customer (leads and deleted customers are always excluded).
- The service belongs to a partner and location selected in the filters, and matches the Plan type, Service status, and Condition filters.
Bundle member services (the individual Internet, Voice, or Recurring services that make up a bundle) are not listed under their own plan type — only the parent bundle is counted. This prevents double-counting.
The customer's signup date and the time when the service record was created are not used. The report answers the question "what services started in this period," not "what services were created or paid for in this period."
¶ Amount
Number of services in the result set, counted per plan type. The Total row sums all four types.
¶ Price
For each service in the result set, Price is its current unit price multiplied by quantity:
- For Internet, Voice, and Recurring services, quantity is always 1, so Price equals the service's unit price.
- For Bundle services, quantity comes from the bundle record (a bundle can be configured with a quantity greater than 1).
The Totals block sums these values per plan type, with the Total row summing all four types.
¶ Old price
Old price is meaningful only for services with Condition = From pending — services that replaced a previously pending service on the same customer. For those rows, Old price is the previous service's unit price multiplied by its quantity.
For first-time services (Condition = New) there is no previous service, so Old price is 0.
¶ Difference price
For each plan type and for the Total row, Difference price equals the row's Price minus its Old price.
- A positive value means the new services produced more revenue than the previous ones (an upgrade).
- A negative value means the new services produced less revenue (a downgrade).
- For first-time services, Difference price equals Price, because Old price is 0.
¶ Reading Old price and Difference price
Use the Condition filter in the advanced filter panel to focus on either side of the comparison:
- Set Condition to New to see only first-time services. Old price and Difference price are not meaningful here — they will mirror the Price column (or be 0).
- Set Condition to From pending to see only services that came from a previously pending one. Old price and Difference price show how revenue changed for those upgrades.
- Leave Condition at All to see both at once. The Difference price in the Totals block then represents the combined revenue change across new sales and upgrades.
¶ Show/Hide columns and export
The detail table supports the standard report toolbar.
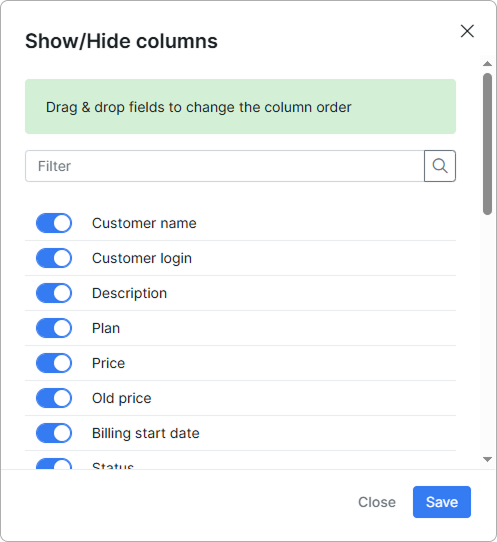
¶ Choosing columns
Use the show/hide columns button  to choose which columns appear and reorder them. Beyond the default columns, the report can also display:
- Customer ID, Id — internal identifiers.
- Partner, Location — the customer's partner and location.
- Unit — service unit (for example, piece or GB).
- Billing end date, Period — when the service ends and its recurring period.
- Discount, Discount value, Discount type, Discount start date, Discount end date, Discount text, Additional discount — discount details applied to the service.
- Contract start date, Contract end date — applicable to bundles.
- Total for services, Quantity — total amount and quantity stored on the service record.
Drag column names to change their order, then press Save.
¶ Exporting the table
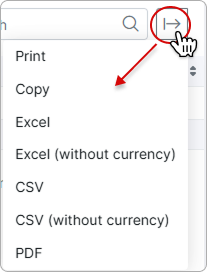
Use the export button  to print, copy, or download the detail table as Excel, CSV, or PDF. Excel and CSV can be exported with or without currency values.
¶ Important notes
- The Period filter applies to the billing start date of each service — not the date the customer signed up, not the date the service record was created, and not the date a payment was received.
- All amounts are shown in the system default currency. Per-customer currency conversion is not applied in this report.
- A service set to status Pending that never became Active still appears if its billing start date falls in the selected period. Use the Service status advanced filter to exclude pending services if needed.
- Bundle member services are excluded from the Internet, Voice, and Recurring totals so a bundle is not counted twice.
- Generation may take from a few seconds to a few minutes for wide periods or large datasets; the report runs as a background task and the page polls until the result is ready.
- Access is restricted to the Super Administrator role. Other roles do not see the report in the menu.