¶ Account statements
- Overview
- Statements tab
- Finance customers report tab
- Receivables aging report
- Data export
- Related pages
¶ Overview
The Account statements page provides financial reporting tools for managing customer account data.
It contains three tabs:
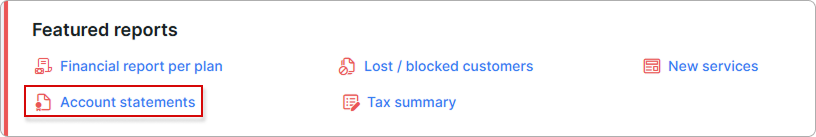
- Statements — Displays customer financial statements based on Transactions or Finance documents (invoices, payments, credit notes). Filter by period and data type, generate and download PDF statements, or send them directly to customers.
- Finance customers report — Displays a per-customer summary of money movement over a chosen period: debit, credit, and the net difference between them. Filter by period, status, partner, location, payment method, or custom fields.
- Receivables aging report — Shows outstanding customer balances categorized by how long they have been due, helping prioritize collections by aging category.
Partner scope: Partner-bound admins always see only the customers in their own partner across all three tabs. The Partners filter cannot widen this for them.
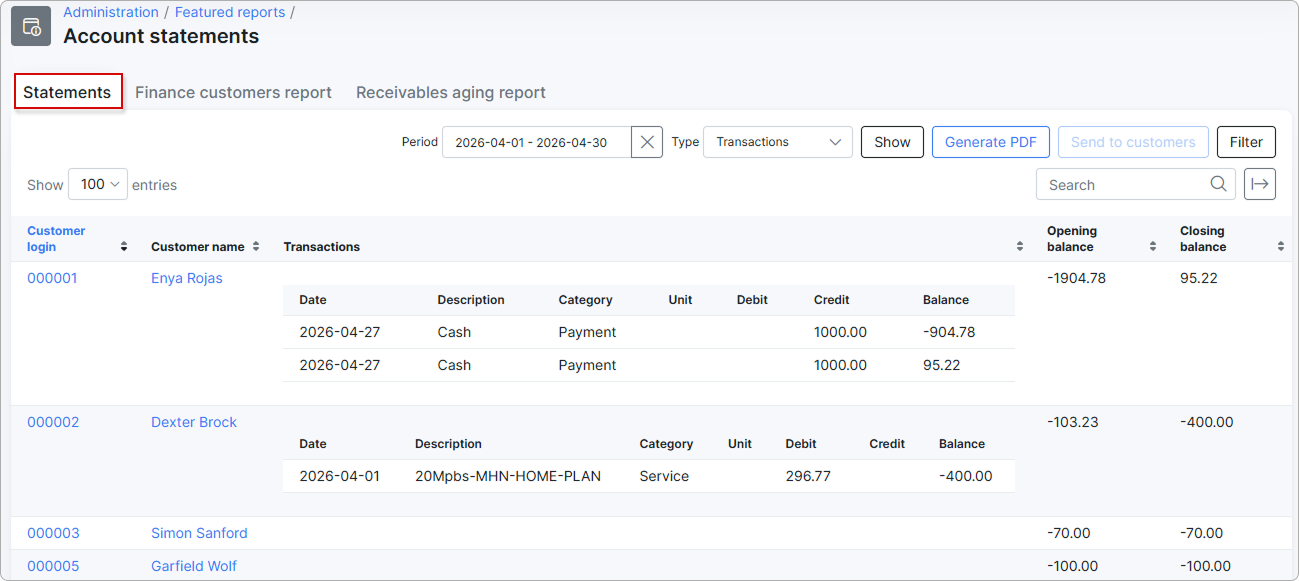
¶ Statements tab
The Statements tab produces a per-customer account statement for a chosen period. Every customer who had financial activity in that period — or who started or ended the period with a non-zero balance — appears in the table together with their opening balance, the items posted to their account during the period, and their closing balance. From here you can also generate a PDF statement for each customer and email it directly to them.
¶ Which customers appear in the report
After you set the Period and the filters and click Show, Splynx scans every customer that matches the filters and decides whether to include them. A customer is added to the table when at least one of these is true:
- Their balance on the day before Date from is not zero — they were already owing money or in credit when the period started.
- Their balance on Date to is not zero — they end the period owing money or in credit.
- They had at least one item posted to their account during the period (a charge, a payment, a credit note, or a manual transaction).
A customer is never included when:
- They have been deleted from Splynx (deleted customers are skipped regardless of how the filters are set).
- They have a zero opening balance, a zero closing balance, and no items in the period — there is simply nothing to put on a statement.
¶ Filters
The filter bar above the table controls the period and the kind of items shown. Click Show to run the report.
- Period — date-range picker that sets the Date from and Date to of the report. Defaults to the current month.
- Type — switches the inner per-customer table between Transactions and Finance documents. The third column heading of the outer table also changes to match (Transactions or Finance documents). Defaults to Transactions.
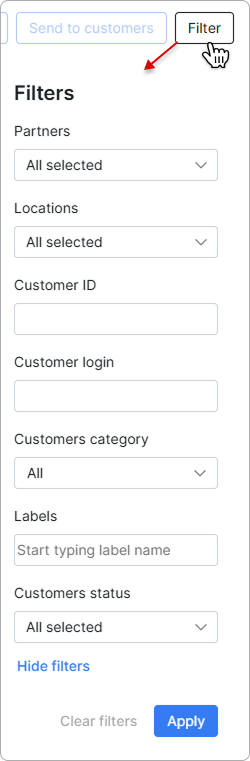
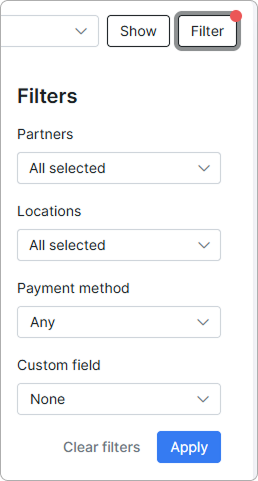
Click Filter to open the Filters side panel for the rest of the search options. After changing values there, click Apply to put them in effect (and Show again to re-run the report); use Clear filters to reset them.
- Partners — multi-select. Limits the report to customers attached to the selected partners. If your admin account is bound to a single partner, this is forced to that partner regardless of what you pick. Defaults to All.
- Locations — multi-select. Limits the report to the selected customer locations. Defaults to All.
- Customer ID — text. Restricts the report to a specific customer ID (an exact match).
- Customer login — text. Restricts the report to a specific customer login.
- Customers category — single-select: All, Individual, Business. Defaults to All.
- Labels — multi-select with search. Limits the report to customers that have at least one of the selected labels; start typing a label name to find it. The filter narrows the table and also applies to the
Generate PDFandSend to customersactions, so only customers that match the selected labels are included in the generated statements. Leave it empty to include customers regardless of their labels (current behavior). - Customers status — multi-select: New (Not yet connected), Active, Blocked, Inactive (Doesn't use services). Defaults to All. Click
Show more filtersin the side panel to reveal this field.
¶ Report types
The selected Type controls both the source of the inner per-customer table and the totals shown at the bottom of each customer's section.
¶ Type = Transactions
Lists every entry posted to the customer's ledger in the period — each individual charge or payment.
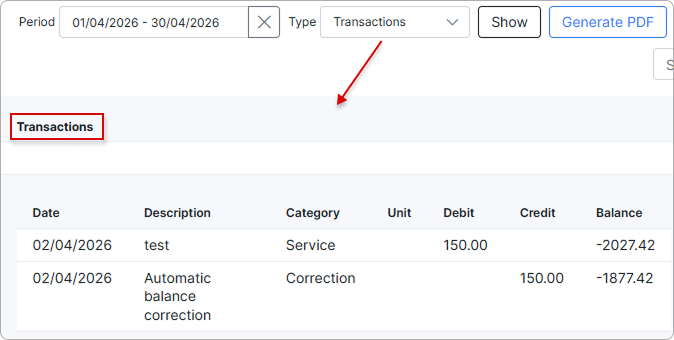
The inner table has these columns:
| Column | Description |
|---|---|
| Date | Date of the transaction. |
| Description | What the transaction was for. |
| Category | The transaction's category (for example, Payment, Charge, Refund). |
| Unit | Unit of the charge, where applicable (for example, month, piece). |
| Debit | Amount charged to the customer in this transaction. |
| Credit | Amount paid by or credited to the customer in this transaction. |
| Balance | Running balance — the customer's opening balance plus everything that happened on the ledger up to and including this row. |
Each customer's section also shows two totals: Debit amount and Credit amount — the sums of all debits and all credits posted in the period.
¶ Type = Finance documents
Lists the actual finance documents created for the customer in the period — invoices, payments, and credit notes — together with any ledger entries that are not tied to a finance document.
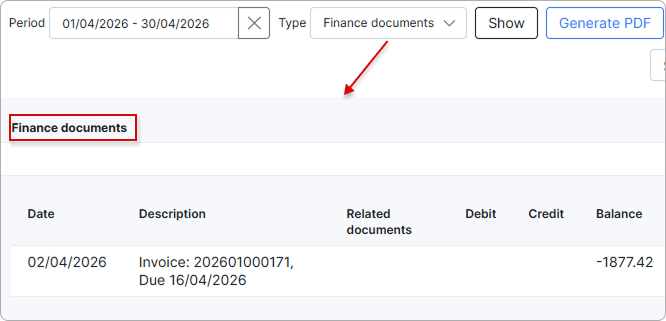
The inner table has these columns:
| Column | Description |
|---|---|
| Date | Date of the document. Invoices and credit notes use their creation date; payments use the payment date. |
| Description | What the document is — for example Invoice: 2026-04-00012 or Payment: 2026-04-00007 (Cash). |
| Related documents | Numbers of any documents linked to this one. For a payment, that is the invoice or credit note it covered; for an invoice, the payment that closed it and any credit notes applied. |
| Debit | Document amount on the debit side (invoices). |
| Credit | Document amount on the credit side (payments and credit notes). |
| Balance | Running balance after this document. |
The merged list is sorted by date so invoices, payments, and credit notes appear in the order they affected the customer's balance. Multiple items dated the same day stay in the order they were entered.
Each customer's section shows two totals for this type: Invoices amount and Payments amount. Credit notes are included with payments because both reduce what the customer owes.
¶ Opening and closing balances
Both the Opening balance and the Closing balance columns are recalculated from the customer's transaction history every time you run the report — they are not read from a stored field, so the numbers always reflect the current state of the ledger.
For each customer, the report walks through every transaction on their ledger up to a given date and sums:
- All credits — payments received from the customer, credit notes, and any other entry that increased what they have on account.
- Minus all debits — invoices, charges, fees, and any other entry that reduced their account.
The result is the customer's running balance as it stood on that date. The two columns apply that calculation to two different cut-off dates:
- Opening balance — the running balance taken across every transaction dated before Date from. This is the customer's account balance the moment the period started.
- Closing balance — the running balance taken across every transaction dated on or before Date to. It is always equal to the opening balance plus the net effect of everything that happened during the period.
Only transactions that move real money on the ledger are counted. Future-dated entries that have been queued but not yet posted to a real invoice or payment are excluded from both balances and from the inner Transactions list, so the closing balance always lines up with the items shown in the customer's statement.
If your Splynx instance has the system-wide Invert account balance setting enabled, the sign of both balance columns is flipped so that a positive number means "the customer owes you" instead of the internal accounting convention. The calculation itself is the same — only the displayed sign changes.
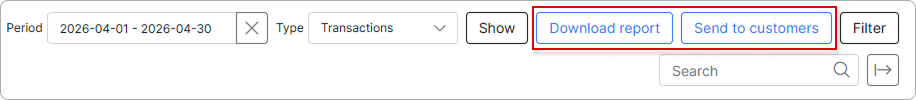
¶ Generate PDF and send to customers
Once you have run the report and the table is filled, two more buttons in the filter bar become active:
Generate PDF— builds a ZIP archive containing one PDF statement per customer in the current view. Each PDF is rendered from the Report statements template configured per partner in Config → System → Company information, so the layout, fields, and language follow the configured template. For long date ranges or "all customers" reports, generation runs in the background and a progress indicator is shown; the table is filled when the task finishes. After the archive is ready, the button label changes toDownload generatedso you can save the archive locally.Send to customers— emails each generated PDF to the customer it belongs to. Splynx sends to the customer's billing email if one is set, otherwise to the regular email. If any of the customers selected do not have an email at all, a confirmation dialog appears listing those customers — you can either cancel the send or confirm to proceed (those customers are skipped). Each successful send is logged on the customer's profile so you can confirm later that a statement was delivered.
Send to customersalways delivers each PDF to a single recipient (billing email or regular email of that customer). To pick the recipient or add CC addresses (for example a finance manager), generate the statement manually from the customer profile — see the Send PDF to customer modal under Customer → Billing → Finance documents → Add document → Statement.
Access to the Statements tab depends on your administrator role. By default, Super administrator, Administrator, Manager, and Financial manager roles can open it.
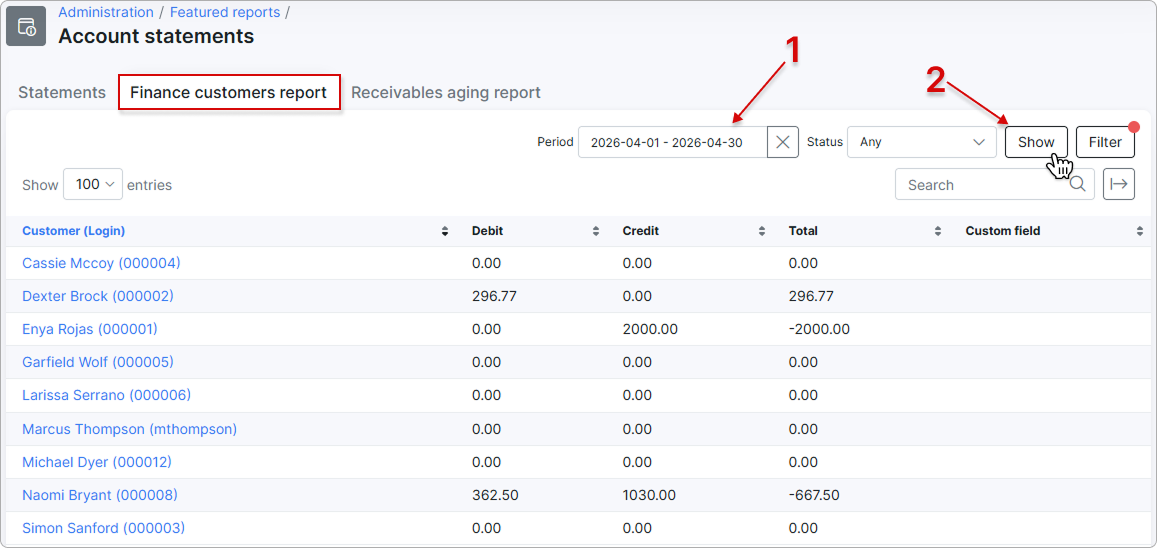
¶ Finance customers report tab
The Finance customers report tab gives a per-customer summary of money movement over a chosen period: for each customer, how much was charged, how much was paid in, and the net difference between the two. There is no opening or closing balance here — this is a pure flow view of what happened during the period.
Use the Statements tab when you also need the customer's balance at the start and end of the period.
¶ Which customers appear in this tab
Unlike the Statements tab, this report does not filter customers by activity. It lists every customer that matches the toolbar and side-panel filters, even when they had nothing happen in the selected period — those customers simply show with 0.00 in Debit, Credit, and Total.
A customer is included when:
- They match every filter you set in the toolbar and the side panel (Period, Status, Partners, Locations, Payment method, Custom field).
- They have not been deleted from Splynx.
If you only want to see customers that had real money move during the period, sort by Debit or Credit descending and ignore the all-zero rows at the bottom.
¶ Finance customers filters
The filters control which customers appear in the table and which date range the Debit, Credit, and Total columns are calculated over. Click Show to run the report; the table is empty until you do.
The toolbar above the table holds the two most-used filters:
- Period — date-range picker that sets Date from and Date to. Defaults to the current calendar month.
- Status — Any, New (Not yet connected), Active, Blocked, or Inactive (Doesn't use services). Defaults to Any.
Click Filter to open the Filters side panel for the rest of the search options. Set values there, click Apply, then click Show again to re-run the report; use Clear filters to reset them.
- Partners — multi-select. Limits the report to customers attached to the selected partners. Forced to your own partner if your admin account is bound to one.
- Locations — multi-select. Limits the report to the selected customer locations.
- Payment method — single-select: Any, Cash, Bank transfer, Credit card, PayPal, Other, or any payment gateway you have enabled (for example, QuickBooks, SageOne, Netcash Pay Now). Filters customers whose default payment method matches.
- Custom field — single-select. Pick any standard customer field (for example, ID, Billing type, Email, City) or any custom attribute you have configured. The selected field is shown as a value in the Custom field column on the right-hand side of the table — one cell per customer. Defaults to None (the column is empty).
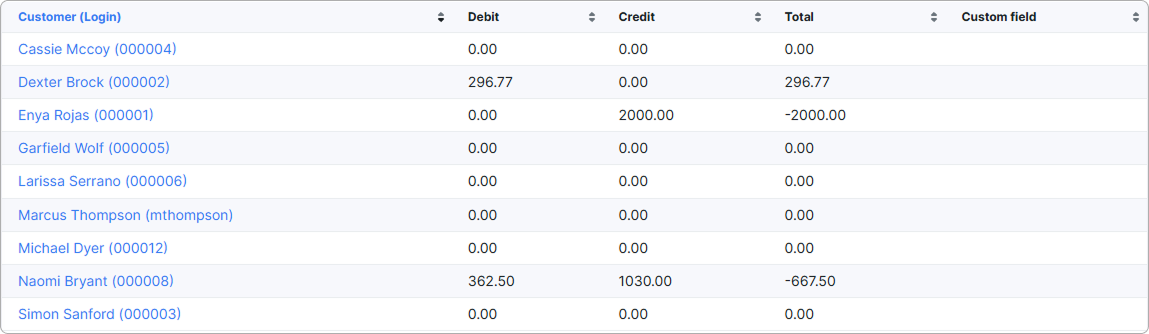
¶ Finance customers table columns
Each row is one customer. The four numeric columns are independent sums for the selected period — there is no running balance.
| Column | Description |
|---|---|
| Customer (Login) | Customer name and login. The name is a link to the customer's profile. |
| Debit | Total amount charged to the customer during the period (services billed, fees, manual debits). |
| Credit | Total amount received from or credited to the customer during the period (payments, manual credits, credit notes). |
| Total | Net effect on the customer for the period: Debit − Credit. A positive number means the customer was billed more than they paid; a negative number means they paid more than they were billed. |
| Custom field | The value of the field selected in the Custom field filter for that customer. Empty when no custom field is selected. |
¶ How Debit, Credit, and Total are calculated
All three numeric columns are computed from the customer's transaction ledger, restricted to entries whose date falls inside the selected Period. The calculation runs separately for each customer, then for each row of the table:
- Debit — adds up every transaction posted on the customer's ledger during the period that charges the customer (invoiced services, manual debits, fees).
- Credit — adds up every transaction posted on the customer's ledger during the period that credits the customer (payments received, manual credits, credit-note adjustments). Refunds posted as a credit-side ledger entry are also included here.
- Total — calculated row by row as Debit − Credit.
Only transactions that move real money on the ledger are counted. Future or recurring charges that have been queued but are not yet attached to an invoice are excluded — they will appear in this report only after the next invoice run posts them. This keeps the report aligned with the customer's true period activity instead of inflating Debit with charges the customer has not actually been billed for yet.
The result depends only on the Period — choose a different date range and the same customer can show very different Debit, Credit, and Total values.
¶ How to read the numbers
The combination of values in Debit, Credit, and Total tells you what the customer's period activity looked like:
- Debit > 0, Credit = 0 — the customer was billed during the period but did not pay anything in that window.
- Credit > 0, Debit = 0 — the customer paid (or was credited) without being billed in the period — typically a top-up, a prepayment, or a stand-alone credit note.
- Total > 0 — the customer's balance moved against them during the period (more billed than paid).
- Total < 0 — the customer's balance moved in their favor during the period (more paid than billed).
- All three are
0.00— the customer matched the filters but had no real-money activity in the period; no statement to explain.
Use the export button above the table to print the report, copy it to the clipboard, or download it as Excel, CSV, or PDF — useful when you want to send a short period summary to accounting or a partner. See Data export for the full list of formats.
Access to the Finance customers report depends on your administrator role. By default, only the Super administrator role can open this tab; ask a Super administrator to grant your role access if you need it.
¶ Receivables aging report
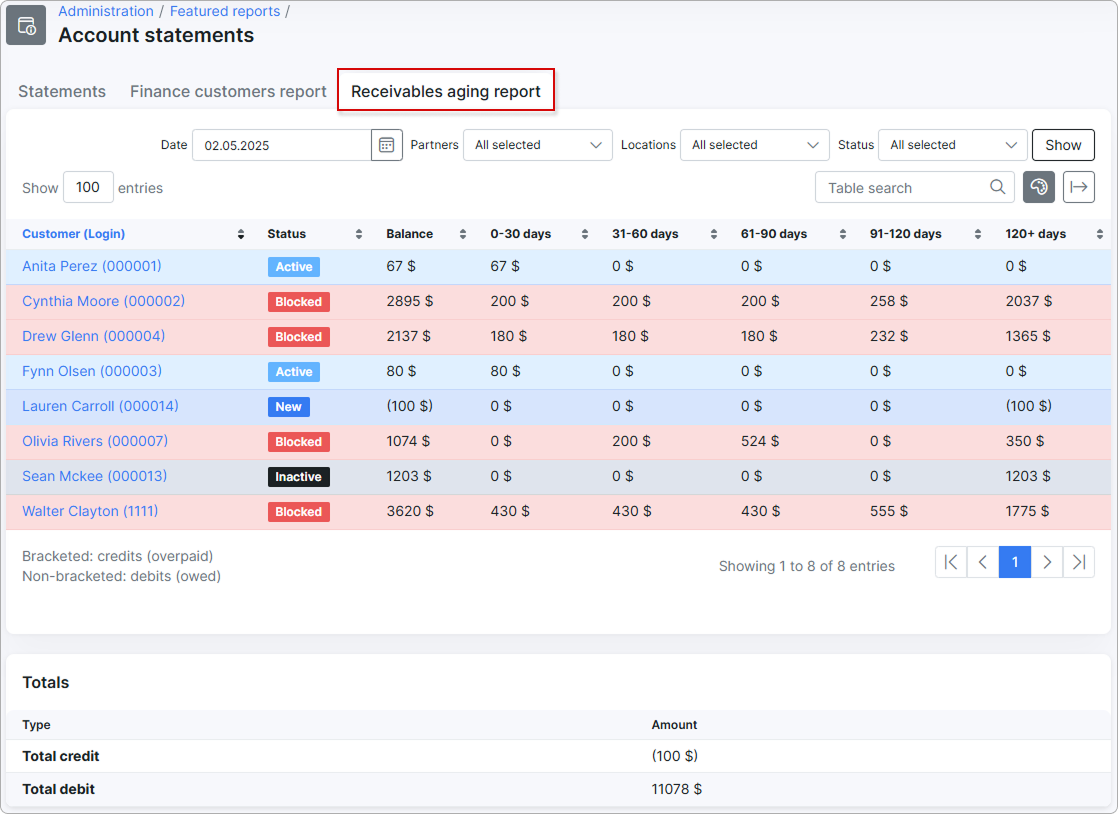
The Receivables aging report lists every customer who has a non-zero balance on the chosen date and breaks that balance into five age buckets, so you can see how old each customer's debt — or overpayment — really is. Use it to prioritize collections (the oldest unpaid amounts come first) and to spot customers who have been sitting on credit that has not yet been used up.
Customers whose balance is exactly zero on the chosen date are not included — only customers who currently owe money or are in credit appear in the table.
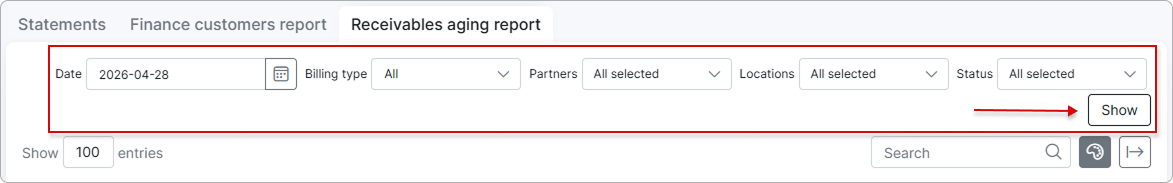
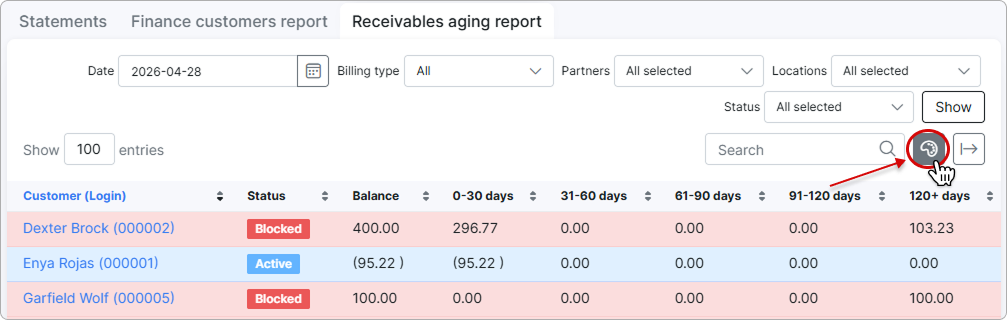
¶ Receivables filters
The filters at the top of the tab control which customers and which date are used for the calculation. Click Show to apply them.
- Date — the snapshot date. The report is recalculated as if "today" were that date, so you can pull a historic aging position (for example, the last day of last month). Defaults to the current date and cannot be set in the future.
- Billing type — narrows the report to customers with the selected billing type (for example, Recurring or Prepaid (Custom)). Defaults to All.
- Partners — limits the report to customers attached to the selected partners. If your admin account is bound to a single partner, this is forced to that partner and cannot be changed. Defaults to All.
- Locations — limits the report to the selected customer locations. Defaults to All.
- Status — limits the report to customers with the selected statuses: New (Not yet connected), Active, Blocked, Inactive (Doesn't use services). Defaults to All.
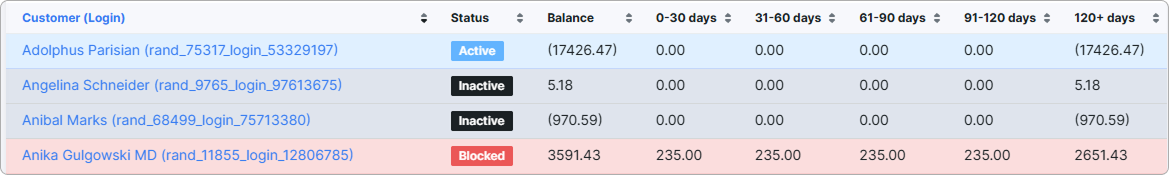
¶ How to read the amounts
Every monetary value in the table follows the same convention, shown in a note directly under the table:
- A plain number (for example,
100.00) is a debit — the customer owes that amount in that bucket. - A bracketed number (for example,
(50.00)) is a credit — the customer is overpaid by that amount in that bucket.
The amount columns sort with this convention in mind: a bracketed
(50.00)is treated as−50for sorting, so debits and credits line up correctly when you sort by Balance or by any of the bucket columns.
¶ Table columns
| Column | Description |
|---|---|
| Customer (Login) | Customer name and login. The name is a link to the customer's profile. |
| Status | Customer status (New, Active, Blocked, Inactive), shown as a colored badge. |
| Balance | The customer's overall balance on the chosen date. If the date is today, this is the live customer balance. For a date in the past, it is recalculated from the customer's transaction history up to and including that date. |
| 0–30 days | The portion of the balance that came from transactions dated within the last 30 days. |
| 31–60 days | The portion that came from transactions dated 31 to 60 days before the report date. |
| 61–90 days | The portion that came from transactions dated 61 to 90 days before the report date. |
| 91–120 days | The portion that came from transactions dated 91 to 120 days before the report date. |
| 120+ days | Everything older — all transactions on the customer's ledger that are more than 120 days old, accumulated together. |
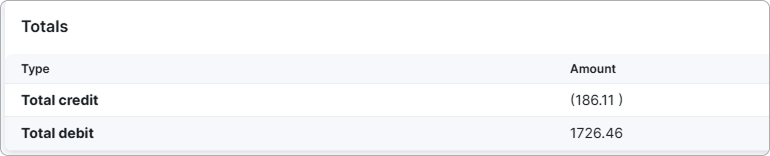
¶ Totals
The Totals block under the table summarizes the customers in the current view. Both totals aggregate per-customer balances, not per-bucket sums:
- Total credit — the sum of all customer balances that are in credit (overpayments). Shown in brackets, like every other credit value in the report.
- Total debit — the sum of all customer balances that are in debit (owed amounts).
¶ Row colors
Click the color palette icon above the table to toggle a status-based tint on the rows, which makes it easier to scan for problem customers. With colors enabled:
- Blocked rows are tinted red.
- Active rows are tinted blue.
- New and Inactive rows pick up their own status tint.
The toggle changes only the row tint; the Status badge in the second column always keeps its color regardless of the toggle.
¶ How aging buckets are calculated
The amount you see in each bucket column is not simply "debits minus credits dated in that range". The report walks each customer's ledger from the oldest entries to the newest and tries to close older debt with newer payments before it shows what is left. This is what makes the report a true aging view: older buckets show what is genuinely still overdue.
The calculation runs in this order for each customer:
- Start with everything older than 120 days. The running balance at the 120-day cut-off is placed into the 120+ days bucket.
- Walk forward through the buckets — 91–120 days → 61–90 days → 31–60 days → 0–30 days. For each bucket, the report:
- Takes the credits (payments) dated in that bucket and uses them to close any debt still open in older buckets first.
- If there is still debit in the current bucket and the running balance is positive (the customer is in credit overall), uses that running credit to pay it off.
- Updates the running balance with whatever debit or credit is left in the current bucket.
- Overdue protection. If the customer is in debit overall (they owe money), the report checks how much of each bucket's debit comes from unpaid invoices of the same age. That portion is treated as locked overdue debt — newer credits in later buckets are not allowed to hide it. So even if the customer made a payment recently, an older unpaid invoice still shows as a debit in its own bucket.
The result of this walk is what each column actually means:
- An older bucket shows what is still genuinely overdue at the report date — either because the customer never paid enough to cover it, or because it is locked by an unpaid invoice.
- A newer bucket that is in credit shows overpayment that has not yet been consumed by older debt.
- A bucket can show
0.00even if the customer had both debits and credits in that age range — they canceled each other out exactly.
Only transactions that move real money on the customer ledger are counted. Transactions that exist only as part of an invoice draft (and were not yet posted as a real charge) are skipped, so the bucket totals stay aligned with the Balance column.
¶ Example
A customer has these entries on their ledger when you run the report:
- 150 days ago: invoice of
200.00(still unpaid) - 80 days ago: invoice of
100.00(paid in full) - 80 days ago: payment of
100.00 - 10 days ago: payment of
50.00
The customer's overall Balance is 150.00 — they still owe 150. The buckets show:
- 120+ days —
200.00debit (the old unpaid invoice; locked by overdue protection so the recent50.00payment cannot hide it). - 91–120 days —
0.00. - 61–90 days —
0.00(the 80-day invoice and payment canceled out). - 31–60 days —
0.00. - 0–30 days —
(50.00)credit (the recent payment that was not consumed by older debt because the older debt is locked).
This makes it clear at a glance that the customer is 150 days late on 200.00, even though they recently paid 50.00.
Access to the Receivables aging report depends on your administrator role's permissions for Administration → Reports. If you do not see the Receivables aging report tab, ask a Super administrator to grant your role access to it.
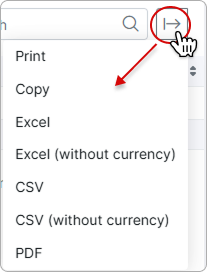
¶ Data export
Use the export button  to print, copy, or export the table in Excel, CSV, or PDF format. Excel and CSV options are available with or without currency values: