¶ Support ticket reports
- Overview
- Closed tickets
- Agent performance
- Performance distribution report
- Activity per admin
- Cost of support
- Related pages
¶ Overview
The Support ticket reports section gives you seven tabs that look at support work from different angles — what got closed, who did what and how fast, how the team's response and resolution times are distributed across the period, a chronological feed of every change an admin made, and how much support each customer consumes against their recurring revenue.
To open the reports, go to Administration → Other reports → Support ticket reports. Only admins with reporting permissions on the ticket module see the link.

The page opens on the Closed tickets tab by default. Click any of the other four tabs across the top to switch view; each tab has its own filter row and its own output.

¶ Closed tickets
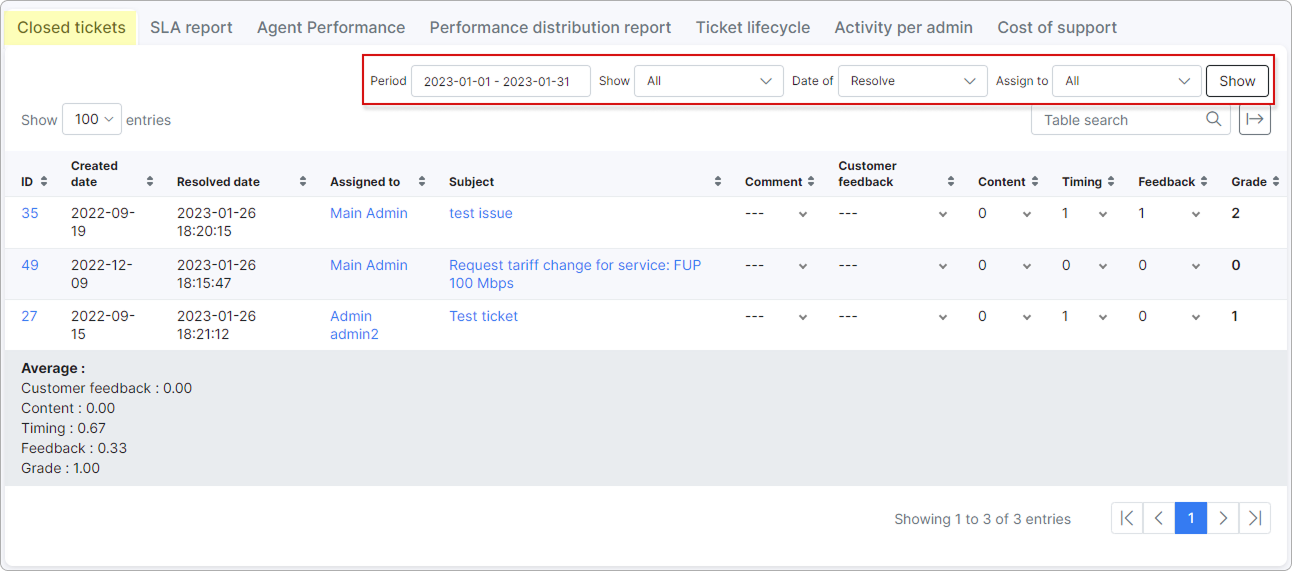
The Closed tickets tab lists tickets that are currently in a closed status and lets you grade the agent who handled each one. It's the place to review what was actually resolved in a given period — by creation date, by last update, or (the default) by the moment the ticket was finally closed.
The list is built fresh every time you click Show — there is no cached snapshot. Reopened tickets, trashed tickets, and tickets that have been moved back to a non-closed status will never appear here, even if they were briefly closed during the selected period.
¶ Filters
The filter row at the top of the tab controls which tickets are listed and how they are matched against the period. Click Show to apply.
- Period — the date range used to match tickets against the Date of mode. Defaults to the current calendar month (from the first day at 00:00:00 to the last day at 23:59:59). Use the date picker to switch to a custom range or one of the presets.
- Show — filters by the in-report archive flag that admins toggle with the mass-archive and mass-restore actions inside this tab. Values: Active (rows that have not been archived in this report), Archived (rows that have been archived), and All (both). The default is All. Mass action buttons appear only when Show is set to Active or Archived.
- Date of — chooses which date is used to match a ticket against Period:
- Resolve (default) — matches by the moment the ticket was last moved into a closed status during the period. Only this mode looks at the ticket's audit history; the other two read a single timestamp from the ticket itself.
- Create — matches by the ticket's creation date.
- Update — matches by the timestamp of the ticket's most recent change. Splynx stores only the latest update on each ticket, so this is not a history-based filter — earlier edits do not put a ticket back in scope.
- Assign to — restricts the list to tickets whose current assignee matches the selected admin. All (default) returns every assignee.
¶ Which tickets appear
A row is included only when all of these are true for the ticket as it stands right now:
- The ticket is currently closed.
- The ticket has not been moved to the trash.
- When Date of = Resolve: the ticket's current status is one of the statuses marked as Closed in Config → Helpdesk → Miscellaneous ticket configuration (Ticket statuses). Custom statuses that have not been flagged as closed are excluded — even if the underlying ticket has
closedset.
In Resolve mode, the report then walks the ticket's history to find the most recent close event that falls inside the selected period, and only keeps the ticket if no later close event exists after the period ends. As a result:
- A ticket can appear at most once per report run. If it was closed, reopened, and closed again, the row carries the date of the latest closing inside the range.
- A ticket whose latest closing happened after the selected period is excluded from that period — it will appear in a later report covering its most recent closing instead.
- A ticket whose latest closing is inside the period appears once, dated to that closing.
In Create and Update modes, each ticket appears at most once because the report compares the Period to a single timestamp stored directly on the ticket.
Custom statuses must be flagged as Closed in Config → Helpdesk → Miscellaneous ticket configuration (Ticket statuses) for the Resolve mode to pick them up. A ticket sitting in a custom status that lacks this flag will never appear in Resolve mode, even though it is technically closed.
¶ Columns
Each row represents one ticket. The default sort is by the report's internal order; click any column header to sort by it.

| Column | Description |
|---|---|
| ID | Ticket ID. Click to open the ticket. |
| Created date | The date the ticket was created. |
| Resolved date / Updated date / Created date | The date used to match the ticket against the Period filter. The column header changes with the Date of filter: Resolved date in Resolve mode (the timestamp of the latest closing event inside the period), Updated date in Update mode (the ticket's last-updated timestamp), and Created date in Create mode (the ticket's creation date). |
| Assigned to | The admin the ticket is currently assigned to. Click the name to open the closed-tickets list filtered by that admin. |
| Subject | The ticket's current subject. |
| Comment | A free-form note you can enter directly in this report. Stored only inside the report, not on the ticket itself, so it does not appear on the ticket page. |
| Customer feedback | A 0 / 1 flag set in this report by admins. Available when the Ticket Feedback add-on is installed. |
| Content | A 0 / 1 flag used to rate the quality of what the agent wrote in the ticket. |
| Timing | A 0 / 1 flag used to rate how quickly the agent responded. |
| Feedback | A 0 / 1 flag used to rate the relevance of the agent's responses to the customer's request. |
| Grade | The sum of Customer feedback, Content, Timing, and Feedback for the row. Calculated only when at least one of those flags is set. |
Each grading flag uses 0 (not adequate) or 1 (adequate). Admins click the value in the cell to toggle it. The values are saved against the report row, not the ticket — they are only visible from this tab.
¶ How values are calculated
¶ Resolved date (Resolve mode)
- Find every history entry for the ticket where the ticket transitioned from open to closed (the previous state was open, the new state is closed) and the status of that change is one of the statuses marked as Closed.
- Keep only the entries that fall inside the selected Period.
- Take the most recent of those entries — that timestamp is what's shown in the Resolved date column.
- Exclude the ticket entirely if it has another valid closing event after the selected period. This keeps the report consistent with the "currently closed" rule when a ticket has bounced between open and closed across multiple periods.
¶ Updated date (Update mode)
The report reads the ticket's last-updated timestamp directly and shows it in the Updated date column. There is no history lookup — only the most recent edit is considered.
¶ Created date (Create mode)
The report reads the ticket's creation date directly and shows it in the Created date column (the third column in the table; the standalone Created date column on the left always carries the same value).
¶ Grade
For each row, the report adds together the 0/1 values of Customer feedback, Content, Timing, and Feedback. Rows where all four flags are unset (blank) have no Grade value.
¶ Average footer
A footer row at the bottom of the table shows the average of Content, Timing, Feedback and Grade across the rows currently displayed by the filter. Rows that have no rating set are excluded from both the count and the sum, so the average reflects only graded tickets.
¶ Examples
Reviewing this month's work. Leave Period on the default (current month), set Date of = Resolve, leave Assign to = All, and click Show. The table lists every ticket whose latest closing happened this month, sorted by ID. Use the grading columns to score each agent's handling and refer to the Average footer for the team-wide rating.
Comparing two agents for a quarter. Set Period to the quarter, Date of = Resolve, and use Assign to to filter to one agent. Note the Average row, then repeat for the second agent and compare.
¶ Important notes
- The Comment, Customer feedback, Content, Timing, and Feedback values are stored against the report row, not against the ticket. Opening the ticket itself will not show them.
- Selecting Archived in the Show filter hides rows that have been archived using the mass-archive action in this report. The archive flag has nothing to do with the ticket's closed state.
- A ticket closed twice in the selected period still appears once, dated to its latest closing inside the range.
- If you just closed a ticket and it is missing from the list, check that the Period covers today and that the ticket's status is flagged as Closed in Config → Helpdesk → Miscellaneous ticket configuration (Ticket statuses).
- A reopened ticket disappears from this tab as soon as it leaves a closed status — the report only ever lists tickets that are currently closed.
¶ Agent performance
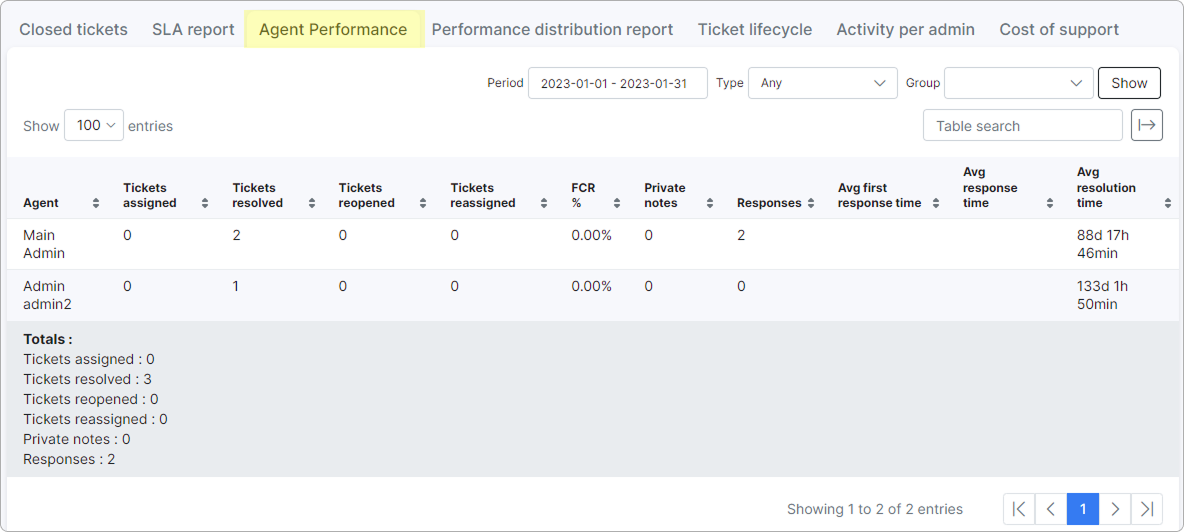
The Agent performance tab summarises, for every admin who has ever worked on a ticket, how much work they did inside the selected period — how many tickets they were given, how many they resolved or reopened, how many replies they wrote, and how quickly they responded on average.
Each cell is built from the ticket audit history (every change to a ticket and who made it) and from the ticket replies themselves. Press Show to run the report. While it builds, a progress bar streams updates; once the result is ready it is cached for one hour, so re-running with the same Period, Type, and Group returns instantly. Changing any filter forces a fresh calculation.
¶ Filters
- Period — the date range applied to every column below. Defaults to the current calendar month (from the first day at 00:00:00 to the last day at 23:59:59).
- Type — limits the report to tickets of a given type. Defaults to Any.
- Group — limits the report to tickets in a given group. Defaults to Any.
¶ Which admins appear
The list of rows is every admin who shows up in the ticket audit history as either the assignee or the actor, and who still has ticket access in Splynx. An admin who never touched a ticket does not appear at all. The list is not filtered by the Period — an admin who was active in earlier months still shows in the table with zeros across every column.
If an admin record has been deleted from Splynx, their row is shown as Deleted agent id#X, but only when they have at least one non-zero value in the chosen Period. If every cell would be zero, the deleted admin's row is hidden.
¶ Columns
| Column | What it counts |
|---|---|
| Agent | The admin's name (or Deleted agent id#X for removed accounts that still have activity in the period). |
| Tickets assigned | Unique tickets that became this admin's during the period, either by being created with them as the assignee or by being reassigned from nobody (unassigned) to them. Agent-to-agent reassignments are not counted here — see Tickets reassigned. |
| Tickets resolved | The number of close events on tickets where this admin was the assignee at the moment of closing. The same ticket counted twice if it was closed, reopened, and closed again during the period with this admin as the assignee both times. |
| Tickets reopened | Unique tickets that moved from a Closed status back to an Open or Unresolved status while this admin was the assignee. Counted once per ticket. |
| Tickets reassigned | Tickets the admin personally gave away to another admin during the period. Tickets taken from this admin by someone else do not count here — only the admin who performed the reassignment is credited. |
| FCR % | First Contact Resolution percentage — the share of this admin's tickets that were closed after exactly one customer message. See How values are calculated. When no tickets match, the cell shows 0.00%. |
| Private notes | The number of internal notes the admin wrote during the period. Counted per message, not per ticket. |
| Responses | The number of public replies the admin wrote to customers during the period. Counted per message, not per ticket — five replies on the same ticket add 5 to this column. |
| Avg first response time | The average time between ticket creation and this admin's first qualifying reply, across every ticket the admin replied to. Format: HH:MM:SS. |
| Avg response time | The average time the admin took to answer a customer message during the period, across every customer / admin reply pair on every ticket the admin touched. Format: HH:MM:SS. |
| Avg resolution time | The average time from ticket creation (or the last reopen) to closing, across every ticket the admin resolved during the period. Format: Dd Hh Mm. |
Splynx classifies ticket statuses as Open, Unresolved, or Closed in Config → Helpdesk → Miscellaneous ticket configuration (Ticket statuses). The same mark drives this report — a status flagged as Closed counts toward Tickets resolved; Open or Unresolved statuses count toward Tickets reopened when a ticket moves back to one of them.
¶ How values are calculated
¶ Tickets assigned
A ticket is counted when either of these happens in the Period:
- It is created with the admin as the assignee.
- It moves from unassigned to the admin (a reassignment from another admin does not count).
The same ticket is counted only once per admin, even if both conditions match.
¶ Tickets resolved
The report counts every audit-history entry where a ticket transitioned from an Open or Unresolved status to a Closed status while this admin was the assignee. The displayed number is the count of those events — so a ticket closed twice in the period contributes 2. The Totals row, however, sums unique tickets, which is why the Totals value can be smaller than the literal sum of the column.
¶ Tickets reopened
The report counts every audit-history entry where a ticket moved from a Closed status back to an Open or Unresolved status while this admin was the assignee, then deduplicates by ticket. Each ticket is counted only once even if it was reopened repeatedly.
¶ Tickets reassigned
The report counts audit-history entries where the assignee changed from this admin to a different admin and the change was performed by this admin. So the column reads as "how many of my tickets I gave away myself" — not "how many were taken from me". If a colleague reassigned this admin's ticket, the event is credited to the colleague.
¶ FCR %
For the Period:
- Denominator — the admin's tickets that are either currently closed or sit in a resolved status, created during the period.
- Numerator — the same set, restricted to tickets that were not opened by an admin and that contain exactly one customer message in total.
- FCR % = numerator ÷ denominator × 100. When the denominator is 0, the cell shows 0.00%.
FCR is per-admin only — there is no totals value.
¶ Private notes and Responses
Both columns are counted from ticket replies written by the admin during the Period:
- Private notes — replies marked as hidden from the customer (internal notes).
- Responses — replies visible to the customer.
Auto-generated system messages are excluded. Each message contributes 1, so multiple replies on the same ticket count multiple times.
¶ Avg first response time
For each ticket created during the Period, the report finds the earliest public, non-system reply written by this specific admin. The time between ticket creation and that reply is the admin's first response time for that ticket. The displayed value is the arithmetic mean across every ticket where the admin has at least one such reply.
The metric is anchored to ticket creation, not to when the ticket was assigned to the admin. An admin who joined a long-running ticket late will inherit a long first-response time even if another admin replied earlier.
¶ Avg response time
For every ticket the admin touched, the report walks the public replies in time order and pairs each customer message with the next reply from this admin. The time between the two is the admin's response time for that pair. The displayed value is the arithmetic mean across every measured pair. Both ends of each pair must lie inside the Period.
Subsequent customer messages received before the admin replies do not start a new clock — the clock only resets after the admin answers.
¶ Avg resolution time
For each ticket the admin resolved during the Period, the report computes the time from the start point to the closing event:
- The start point is the ticket's creation date.
- If the ticket was reopened earlier in the period and then closed again, the start point is the most recent reopen instead.
The displayed value is the arithmetic mean across every resolution event the admin handled. There is no business-hours adjustment — nights, weekends, holidays, and "waiting for customer" time all count.
All time averages use wall-clock time and have no business-hours calendar. Tickets that wait overnight for a customer reply still accumulate time toward Avg response time and Avg resolution time.
¶ Totals row
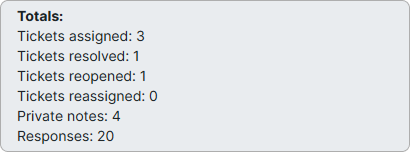
A Totals row at the bottom of the table summarises the counted columns. The average columns and FCR % are left blank in this row.
| Total | What it sums |
|---|---|
| Tickets assigned | The unique-ticket counts per admin |
| Tickets resolved | The unique-ticket counts per admin (not the event count shown in the column above, which is why the total can be smaller than the literal column sum) |
| Tickets reopened | The unique-ticket counts per admin |
| Tickets reassigned | The reassignment event counts per admin |
| Private notes | The message counts per admin |
| Responses | The message counts per admin |
¶ Examples
Month-end agent review. Leave the filters on defaults (current month, Type Any, Group Any) and click Show. The table lists every admin with at least one ticket touch in their history, with this month's tallies on each row. Compare Tickets resolved against Responses to spot agents who answered a lot but closed few, or against Avg first response time to spot slow first contacts.
Group-specific report. Set Group to the team you want to review — only tickets in that group feed every column. Useful for evaluating tier-1 versus tier-2 work separately.
¶ Important notes
- The same ticket can appear in several admins' columns. Tickets assigned credits the admin holding the ticket, Tickets resolved credits the admin who closed it, Responses credits the admin who wrote the message, and so on. There is no single "owner" of a ticket in this report.
- A reassignment is not a new Tickets assigned. Only first-time assignments — at ticket creation or from unassigned — feed that column. Agent-to-agent handovers feed Tickets reassigned on the admin who handed the ticket off.
- Tickets resolved can outrun Tickets assigned. An admin can close a ticket that was assigned to them in an earlier period, so the resolved count is not bounded by the assigned count.
- Avg first response time is per-admin, not per-ticket. The first reply by another admin on the same ticket does not contribute to this admin's average.
- Deleted admins are hidden when every cell would be zero. If they have any activity in the period, they appear as Deleted agent id#X with the work attributed to them.
- The report is cached for 1 hour keyed by Period, Type, and Group. Running the same combination again before the cache expires returns the cached result; changing any filter triggers a fresh calculation. Edits to tickets that have already been counted are reflected only after the cache expires or after Splynx invalidates it automatically following ticket changes.
¶ Performance distribution report
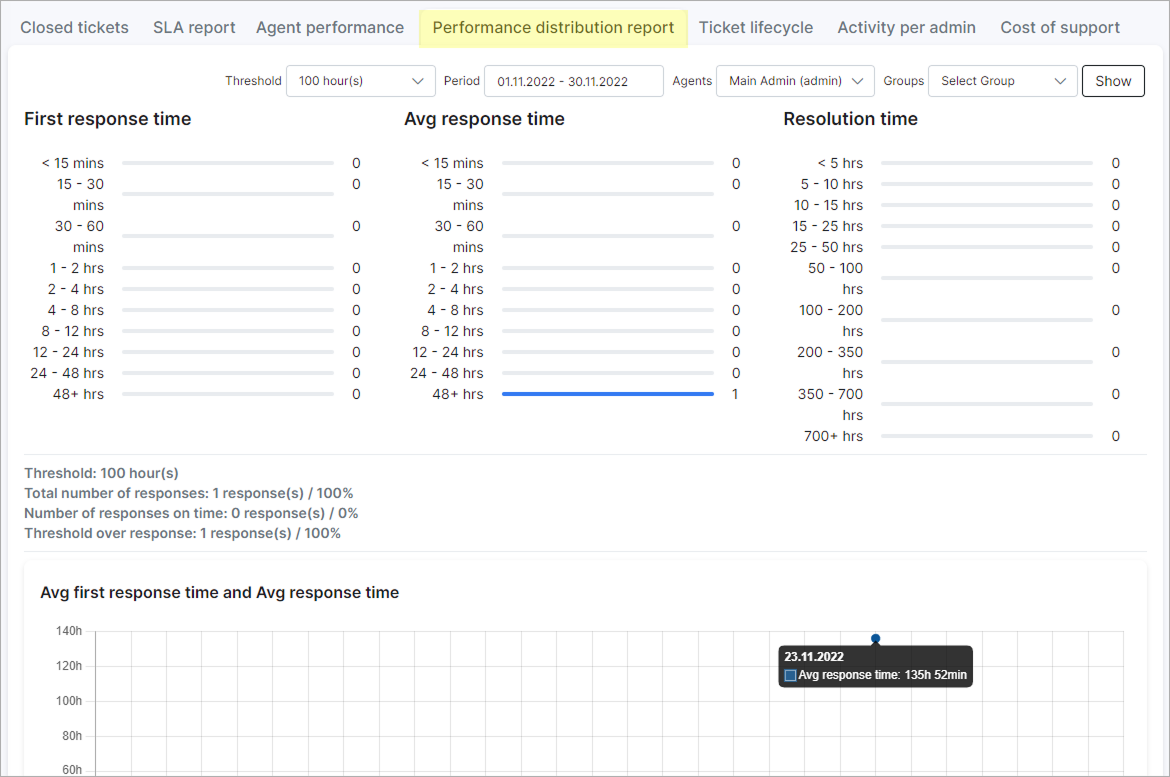
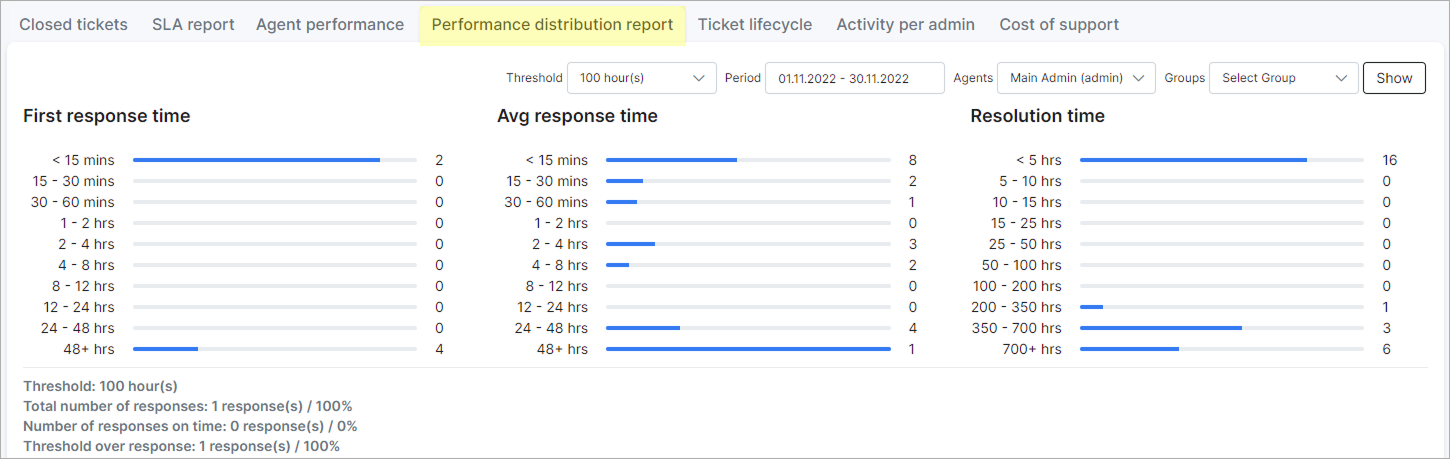
The Performance distribution report tab shows how response and resolution times are spread across the selected period — not just an average, but how many tickets sat in each speed bracket. It is built from three distribution bar charts, a four-line summary, and two daily trend line charts.
Every chart is recomputed from scratch each time you click Show — there is no caching on this tab.
¶ Filters
The filter row sits above the charts. The order on screen is Threshold, Groups, Administrators, Period, followed by the Show button.

- Threshold — a target response time in hours, used only by the four-line summary block to the right of the top section. Allowed values are 1 through 100; the default is 100 hour(s). Threshold has no effect on any of the five charts.
- Groups — limits the set of admins whose work is counted. Picking a group means "include only admins who belong to this group", not "include only tickets in this group". The default is All groups.
- Administrators — narrows the agent list further to a single admin. When set, Groups is effectively ignored. The default is All administrators.
- Period — the date range applied to ticket creation, message timestamps, and history events. Defaults to the current calendar month (from the first day at 00:00:00 to the last day at 23:59:59).
The Groups filter narrows the agent list, not the ticket list. A ticket of any type and in any group can contribute to the charts as long as one of the selected agents replied to it or resolved it.
¶ Top section — three distribution charts
The top of the tab is a row of three horizontal bar charts that show the same data shape: a histogram of how many tickets fell into each speed bracket during the period. The number on the right of each row is the absolute count of tickets in that bracket; the blue bar shows that count as a share of the total.
¶ First response time
Buckets by the time from ticket creation to the agent's first qualifying public reply:
- < 15 mins
- 15-30 mins
- 30-60 mins
- 1-2 hrs
- 2-4 hrs
- 4-8 hrs
- 8-12 hrs
- 12-24 hrs
- 24-48 hrs
- 48+ hrs
Each bracket is left-inclusive and right-exclusive — a reply made at exactly 15 minutes lands in 15-30 mins, not in < 15 mins. Only public replies from one of the selected admins count; private notes and system messages are ignored, and the ticket itself has to have been created inside the Period.
¶ Avg response time
Same ten buckets as First response time, but the source is customer-to-agent reply latency instead of first-response time. For every ticket, the report walks the public messages in time order and pairs each customer message with the next reply from one of the selected admins. The time between the two ends up in one bracket. A ticket with multiple customer-agent exchanges contributes multiple measurements.
¶ Resolution time
A different bucket scale that reflects the slower pace of resolution:
- < 5 hrs
- 5-10 hrs
- 10-15 hrs
- 15-25 hrs
- 25-50 hrs
- 50-100 hrs
- 100-200 hrs
- 200-350 hrs
- 350-700 hrs
- 700+ hrs
Each resolution measurement is the time from the ticket's creation date (or its last reopen before the resolution, whichever is later) to the moment the ticket was closed. Tickets closed by an admin outside the selected agent set are not counted.
¶ Summary block
To the right of the top section sits a four-line summary that uses only the Avg response time measurements (customer-to-agent reply pairs):
- Threshold — the value you picked in the filter, shown in hours.
- Total number of responses — every customer-to-agent reply pair found in the period across the selected agents.
- Number of responses on time — pairs whose latency was at or below the Threshold, plus the share of the total.
- Threshold over response — pairs whose latency exceeded the Threshold, plus the share of the total.
The summary lets you check, at a glance, what fraction of customer messages got an answer within an agreed target. Lower the Threshold to a more demanding target (for example, 4 hour(s)) and the Number of responses on time shrinks; raise it and the share grows.
¶ Bottom section — two trend charts
Below the top section are two daily trend line charts. The x-axis is every calendar day in the Period (one tick per day, even days with no activity).
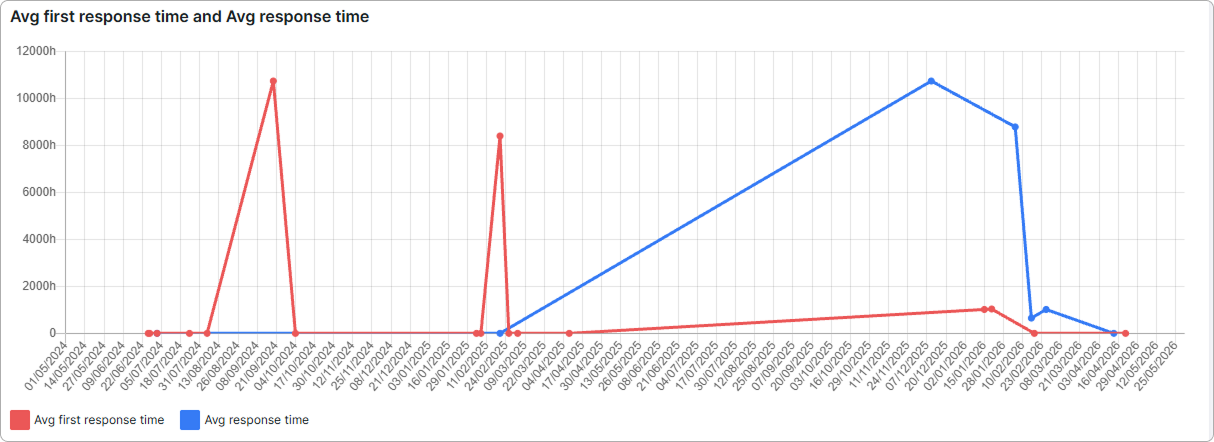
¶ Avg first response time and Avg response time
A combined chart with two series:
- The red line plots the Avg first response time of tickets created on each day.
- The blue line plots the Avg response time of customer-agent reply pairs that happened on each day.
The two lines share the same x-axis but use different timestamps to bucket each day:
- The red line buckets each first-response measurement by the ticket creation date.
- The blue line buckets each customer-agent reply pair by the agent reply date.
So peaks on the two lines can fall on different days even when they reflect the same ticket. A reply written today on a ticket that was opened last week shifts the blue line today but the red line on the day the ticket was created.
¶ Avg resolution time trend
A separate chart with a green line. Each measurement is the time from ticket creation (or the last reopen before resolution) to the moment the ticket was closed, bucketed by the resolution date.
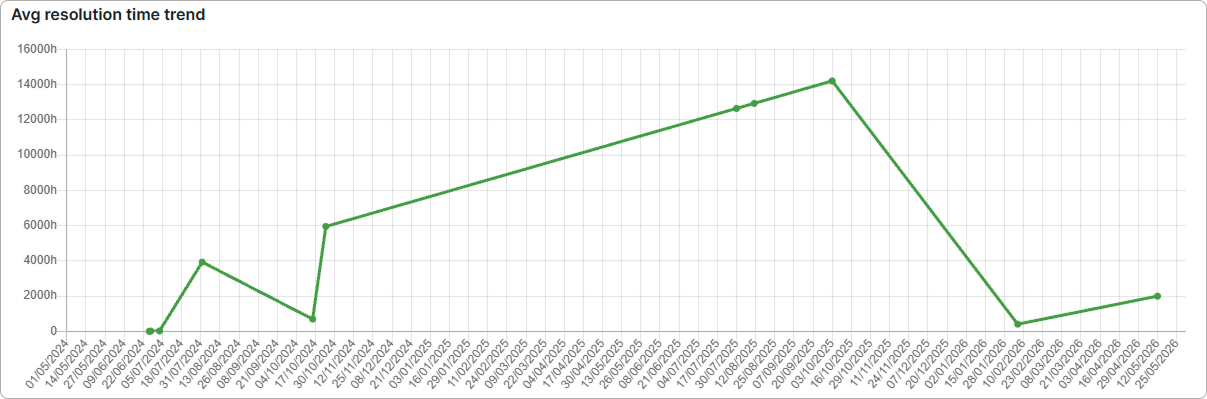
Despite the chart titles using the word Avg, the daily value plotted on each trend line is the sum of the response or resolution times that fell on that day — not the arithmetic mean. A single very slow case on a quiet day can produce a tall spike that looks like a bad average.
Example: three first-response measurements of 2 h, 3 h, and 1 h on the same day produce a data point of 6 h, not 2 h. A single resolution measurement of 1600 h shows the day at 1600 h even if it represents one ticket that finally closed after sitting open for months.
¶ How values are calculated
¶ First response time
For each ticket created in the Period, the report finds the earliest public reply written by any of the selected admins. The time between the ticket's creation and that reply is the first-response measurement for the ticket. A ticket whose first qualifying reply came from an admin who is filtered out does not contribute. There is no business-hours adjustment — wall-clock time runs through nights, weekends, and holidays.
The histogram counts how many measurements fall into each bracket.
¶ Avg response time (the bar chart)
For each ticket touched by one of the selected admins, the report walks the public messages in chronological order. The first customer message opens a "pending pair"; the first reply from one of the selected admins closes it and emits a customer-agent latency measurement. Other admins' replies are skipped — they do not close a pending pair, and they do not start one. Both timestamps in a pair must lie inside the Period.
The histogram counts every measurement, not unique tickets — a ticket with five customer-agent exchanges contributes five measurements.
¶ Resolution time
For each ticket that was resolved or moved to a Closed status during the Period by one of the selected admins:
- The start time is the ticket's creation date by default.
- If the ticket was reopened earlier in the period and then resolved again, the start time is the most recent reopen instead.
The end time is the resolution event itself. The histogram counts each measurement once.
¶ Summary block calculations
- Total number of responses is the count of customer-agent reply pairs in the Avg response time list.
- Number of responses on time counts the pairs whose latency was at or below the Threshold in hours, and shows that share.
- Threshold over response is the remainder — pairs that exceeded the Threshold, with their share.
¶ Trend chart calculations
For each day in the Period, the report sums the relevant measurements that fall on that day:
| Series | Source measurements | Day bucket uses |
|---|---|---|
| Avg first response time (red) | First-response times | Ticket creation date |
| Avg response time (blue) | Customer-agent reply pairs | Agent reply date |
| Avg resolution time (green) | Resolution times | Resolution date |
Days with no measurements are plotted as gaps (the line skips over them). Values are shown as Xh Ymin on hover.
¶ Examples
SLA-style check. Set Threshold to your service-level target (for example, 4 hour(s)), leave the rest on defaults, and click Show. The summary block tells you what share of customer messages got an answer in time.
One agent's workload shape. Pick a single admin in Administrators, leave the Period on the current month, and click Show. The three top charts show how the admin's first responses, customer-agent latencies, and resolution times are distributed across the buckets. The trend lines show the workload day by day.
¶ Important notes
- The trend charts sum, they do not average. Every spike on the red, blue, or green line is the daily total of times in hours — a tall peak can be one slow case rather than many.
- The three top charts and the trend charts use different timestamps to bucket the same measurement. The same ticket can appear in different positions on the red and blue trend lines because the red line uses the ticket creation date and the blue line uses the agent reply date.
- Groups and Administrators filter the agents, not the tickets. Tickets in any group can feed the report as long as one of the selected admins replied to or closed them.
- A ticket can contribute one first-response measurement to every selected admin who replied to it — first response here is "first reply by one of the selected agents on that ticket", not "the absolute first reply ever".
- A reply from an admin who is not in the selected agent set is skipped during the response-time walk. It does not start a new pair and it does not consume the pending one.
- All times are wall-clock seconds. There is no business-hours calendar.
- The Threshold filter changes only the summary block. The three distribution charts and the two trend charts ignore it.
¶ Activity per admin
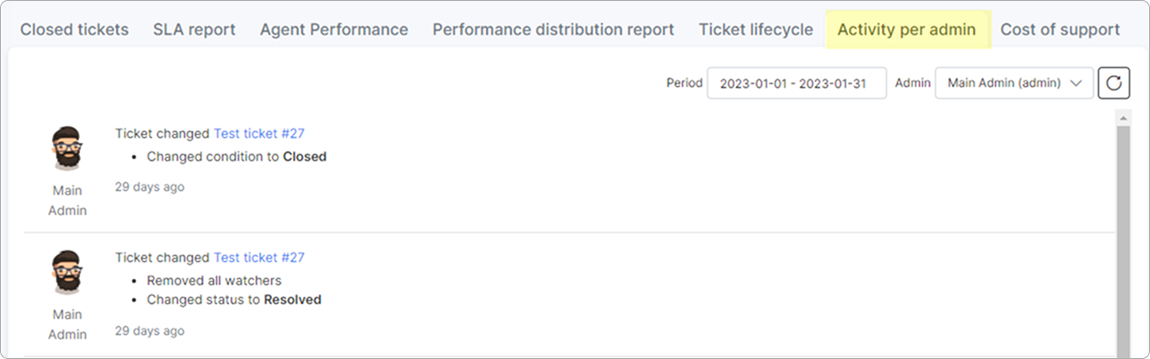
The Activity per admin tab is a chronological feed of individual ticket events — replies, private notes, and metadata changes — written by the chosen admin during the period. Unlike every other tab, this one is not an aggregated report: there are no charts, no totals, no averages. Each card on the feed is one literal entry from a ticket.
Use it to see exactly what an admin did across all tickets in a date range, in the order it happened.
¶ Filters
- Period — the date range used to match each event. Events are matched by their date (day only — the time of day is not part of the comparison), so the boundaries are full calendar days. Defaults to the current calendar month.
- Admin — restricts the feed to events written by the selected admin. Defaults to All, in which case messages from customers also appear in the feed.
The filters apply on change — pick a value and the feed reloads immediately. You can also use the refresh icon. There is no separate apply button.
¶ What each card on the feed shows
Each card represents one event on a ticket. The card has:
- An avatar and the author's name, plus a role label in parentheses (for example, (admin) for an admin, (customer) for a customer, (API) for an automated API user). Deleted admins still appear, marked as deleted.
- A header that describes what the event is and links to the ticket. The wording depends on the event type:
- Created — the very first message of the ticket. The card body shows the message text.
- Replied — any subsequent reply on the ticket. The card body shows a short preview of the reply.
- Added a private note — an internal note (hidden from the customer). The card body shows a short preview.
- Ticket changed — a metadata change such as a status update, reassignment, or change of group, type, or priority. The card body lists the field that changed and the new value (for example, Changed condition to Closed).
- A ticket link in the header. Clicking it opens the ticket: open tickets open in the "Opened" view, closed tickets in the "Closed" view. Admins without permission to view tickets see the subject and ID as plain text.
- A timestamp shown as a relative time (for example, 44 minutes ago) with the absolute date and time alongside (for example, 12/05/2026 02:55:45 PM).
Splynx generates Ticket changed events automatically whenever a ticket's status, assignee, group, type, or priority is edited. The author is the admin who performed the change. Customer-side events such as replies from the Customer portal appear too when Admin is set to All.
¶ Loading more events
The feed loads events in batches as you scroll. Each batch brings in up to 35 cards. When you near the bottom of the page, the next batch is fetched automatically. The feed stops loading when no more events match the filters.
Changing Period or Admin resets the feed and starts loading from the most recent event again.
¶ How the feed is ordered
Cards are listed newest first, by the order Splynx stored each event internally. In practice this matches the time the event happened, but a backdated event would not be re-sorted to its date position — it stays where it was inserted.
¶ What is not in this feed
- No aggregation — there is no count of replies, no average response time, and no SLA. Each card is one event.
- No ticket views or read receipts — "ticket viewed by X" entries appear in the Tickets dashboard but not on this report.
- No events from trashed tickets — if a ticket is currently in the trash, none of its events appear, even events written before the ticket was trashed. Restoring the ticket from the trash brings them back.
- No events from merged messages — when two tickets are merged, the duplicated copies created by the merge do not appear in the feed.
- Partner-scoped admins see only their partner's activity — an admin tied to a specific partner sees events authored by other admins of the same partner or written on tickets of the same partner's customers. Admins on the main account see every partner's activity.
¶ Example
To audit one admin's work for the previous month:
- Set Period to last month.
- Pick the admin in Admin.
- Scroll through the feed — each card is one reply, note, or ticket change that admin authored, newest first. Use the ticket links to jump to any specific ticket.
Switch Admin back to All to see customer replies on the same tickets interleaved with the admin's events.
¶ Important notes
- The Period matches event dates, not date plus time. A period starting on 01/05/2026 includes every event from that calendar day, regardless of the time of day.
- Selecting All in Admin means the feed shows messages from customers and API users as well, not only from admins.
- The card body is shown in full for Ticket changed events so you can read the change description. Regular replies and private notes are shown as short previews — open the linked ticket to read the full message.
- The feed has no caching layer. Every scroll fetches fresh data, so events written seconds before are visible on the next batch.
¶ Cost of support
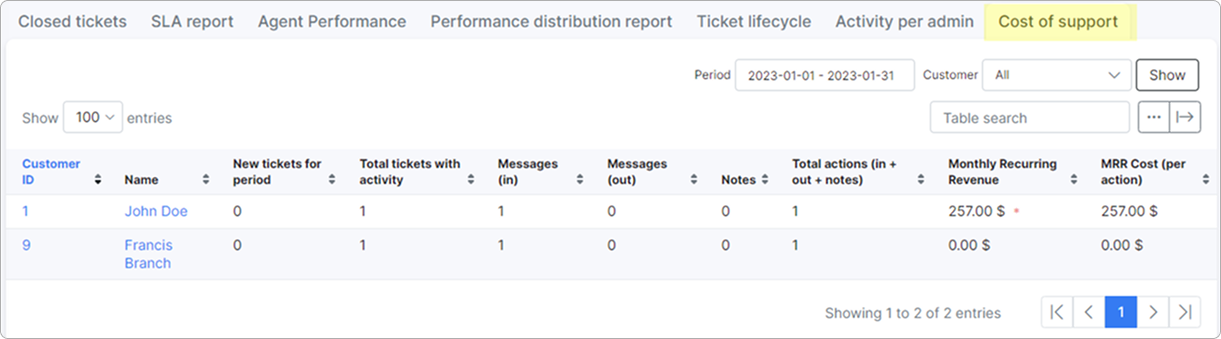
The Cost of support tab estimates how much support work each customer consumed during the period and what that work costs per ticket message against the customer's monthly recurring revenue. Use it to spot customers whose support load is large relative to the revenue they bring in.
The report runs as a background task — when you click Show, the request returns immediately and the table fills in once the worker finishes. Closing the tab while it's still running cancels the task.
¶ Filters
- Period — the date range used to match ticket events and to average the customer's MRR. Defaults to the current calendar month (from the first day at 00:00:00 to the last day at 23:59:59).
- Customer — limits the report to one customer. Defaults to All. The dropdown lists every customer who has any ticket history, regardless of date.
¶ Which customers appear
A customer is included only if, during the Period, at least one of the following happened on their tickets:
- A message was created — a reply, a private note, or the very first message of a ticket.
- A new ticket was attributed to them — either a brand-new ticket or a ticket reassigned onto them from a different customer.
Customers whose only ticket events in the period are metadata changes (status updates, reassignments between admins, priority edits, and so on) do not appear — there must be at least one message event or one new-ticket event.
If a row shows Deleted customer, id:<n> in the Name column, it means the ticket history still references a customer whose record has since been removed from Splynx.
¶ Columns
The table has thirteen columns in total. Ten are shown by default; three more — Login, Cost per incoming message, and Cost per outgoing message — are hidden and can be turned on with the show/hide columns button above the table.
| Column | Default | What it shows |
|---|---|---|
| Customer ID | shown | The customer's ID. Click to open the customer's profile. |
| Name | shown | The customer's name. Deleted customer, id:<n> if the record no longer exists. |
| Login | hidden | The customer's login. Deleted customer, id:<n> if the record no longer exists. |
| New tickets for period | shown | The number of tickets attributed to this customer for the first time during the period — either by being created with them as the customer, or by being reassigned onto them from another customer. See How values are calculated. |
| Total tickets with activity | shown | The number of distinct tickets on which any message was written during the period (reply, private note, or first message). A ticket whose only event in the period is a metadata change is not counted. |
| Messages (in) | shown | The number of public messages the customer wrote during the period. |
| Messages (out) | shown | The number of public messages sent on the ticket by an admin, an API user, or by Splynx itself during the period. |
| Notes | shown | The number of private notes written on the customer's tickets during the period. The author can be anyone — the field counts every note regardless of who wrote it. |
| Total actions (in + out + notes) | shown | The simple sum of Messages (in), Messages (out), and Notes. |
| Monthly recurring revenue | shown | The customer's average MRR over the days in the period for which Splynx has an MRR snapshot. Formatted in the system currency. An asterisk (*) after the value means the most recent snapshot is older than 2 days — see How values are calculated. |
| MRR Cost (per action) | shown | The customer's MRR divided by Total actions. Shows roughly how much one piece of support work costs relative to the customer's recurring revenue. Shows 0.00 when there are no actions or no MRR. |
| Cost per incoming message | hidden | The customer's MRR divided by Messages (in). Shows 0.00 when the customer wrote no incoming messages in the period or has no MRR. |
| Cost per outgoing message | hidden | The customer's MRR divided by Messages (out). Shows 0.00 when no outgoing messages were sent on the customer's tickets in the period or the customer has no MRR. |
A small
*next to the Monthly recurring revenue value means the figure is historical — Splynx hasn't written a new MRR snapshot for that customer in more than two days. The customer is probably in a status that doesn't qualify for new snapshots (for example, New, Disabled, or Pending); the value shown is the last MRR captured before they left an eligible status. The table also shows a warning banner at the top when any row carries an asterisk.
¶ How values are calculated
¶ New tickets for period
A ticket is counted when either of these happens during the period:
- A brand-new ticket is created with this customer as the ticket owner.
- An existing ticket is moved onto this customer from a different customer (Splynx tracks the change in the audit history).
The same customer can show a positive New tickets for period even when no new ticket was actually opened on their account, simply because tickets were reassigned to them. The customer the ticket was moved away from is not credited with a decrease.
¶ Total tickets with activity
While walking the ticket history for the customer, every ticket that had at least one message-creation event in the period is counted once. Tickets that only changed metadata in the period (status, priority, group, type, or assignee changes) are not counted as "with activity".
¶ Messages (in) / Messages (out) / Notes
For every message-creation event in the period, Splynx checks the underlying message:
- If the message is private (hidden from the customer), it is counted under Notes — the author does not matter.
- If the message is public and the customer themselves wrote it, it counts under Messages (in).
- If the message is public and the writer is an admin, an API user, or a system reply, it counts under Messages (out).
Each message contributes 1 to exactly one of the three columns. A customer who sent five replies to the same ticket adds 5 to Messages (in).
¶ Monthly recurring revenue
Splynx writes a daily MRR snapshot for every customer in an eligible status. The snapshot is the monthly equivalent of the customer's active services on that day — daily price of each service (with discounts and quantity applied), multiplied by the number of days in the current month. Customers in non-eligible statuses (for example, New, Disabled, or Pending) skip the snapshot for that day.
For this report, the daily snapshots inside the Period are averaged:
- Monthly recurring revenue = sum of daily snapshots in the period ÷ number of days in the period that had a snapshot.
So the value is the average MRR across the days the customer was eligible. Days without a snapshot don't shrink the result — the denominator counts only the days that did have one.
If the most recent snapshot is older than 2 days, the value is suffixed with * and a warning banner appears at the top of the report.
The Monthly recurring revenue column is a monthly figure, but the message counters are totals over the selected period. Selecting a longer Period does not multiply the MRR — every snapshot already represents the monthly equivalent. To compare cost per action fairly across periods, run the report on a one-month range.
¶ MRR Cost (per action), Cost per incoming message, Cost per outgoing message
All three cost columns are simple divisions of the customer's Monthly recurring revenue:
- MRR Cost (per action) = MRR ÷ Total actions.
- Cost per incoming message = MRR ÷ Messages (in).
- Cost per outgoing message = MRR ÷ Messages (out).
Any cell where the denominator is 0 — or where the customer's MRR itself is 0 — shows 0.00. The Cost per incoming message and Cost per outgoing message columns are hidden by default; turn them on via the show/hide columns button to see them.
¶ Examples
Find expensive customers for the month. Leave the defaults, click Show, then sort by MRR Cost (per action) descending. Customers at the top consume the most support work per unit of recurring revenue — either because they have a lot of messages, a low MRR, or both.
Audit one customer. Pick the customer in the Customer filter to compute only that row.
¶ Important notes
- A customer with only metadata changes during the period does not appear. The report needs at least one message event or one new-ticket event to include the row.
- Messages (in) counts messages the customer authored. If a reply was made on behalf of the customer by an admin or via API, it counts under Messages (out) instead.
- A customer can appear with non-zero New tickets for period without anyone opening a new ticket on their account, because reassignments between customers also count.
- MRR is averaged, not summed. Two-month and one-month periods produce roughly the same MRR figure for the same customer. To compare cost across periods, stick to one-month ranges so the message counters match the MRR scale.
- Monthly recurring revenue is a daily snapshot read — the report does not recompute services live. Recent service or discount changes are reflected only after the next daily cron run.
- An asterisk (
*) on the MRR value indicates historical data — the customer's status has stopped qualifying for new snapshots, and the figure is whatever was last captured before that. - The report has no caching of its own. Clicking
Showagain recomputes the message counters; the MRR side reads the most recent snapshot regardless.