¶ Transaction categories
- Overview
- Filters
- Table
- How values are calculated
- Inter-Partner Invoicing handling
- How to read a row
- Export
- Important notes
- Related pages
¶ Overview
The Transaction categories report breaks down all billing activity over a selected period by transaction category — also called a revenue stream — so you can see how each category contributed to invoiced revenue, tax, and data top-up sales. Use it for end-of-month financial review, to compare service revenue against data top-up revenue, or to spot categories where credits and refunds have eroded the net.
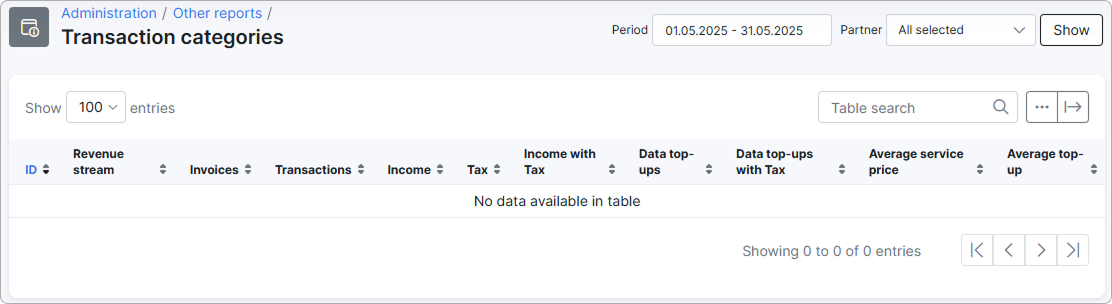
The report is a sortable table — there is no chart. Each row is one transaction category; every numeric column is a sum or count of transactions whose transaction date falls inside the selected period.
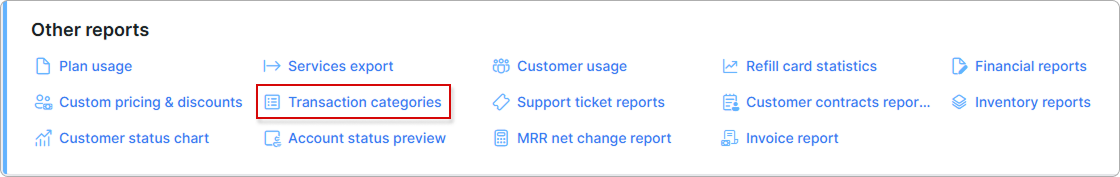
To open the report, go to Administration → Other reports → Transaction categories.
The report is available to administrators with the Super administrator, Administrator, Manager, or Financial manager role.
¶ Filters
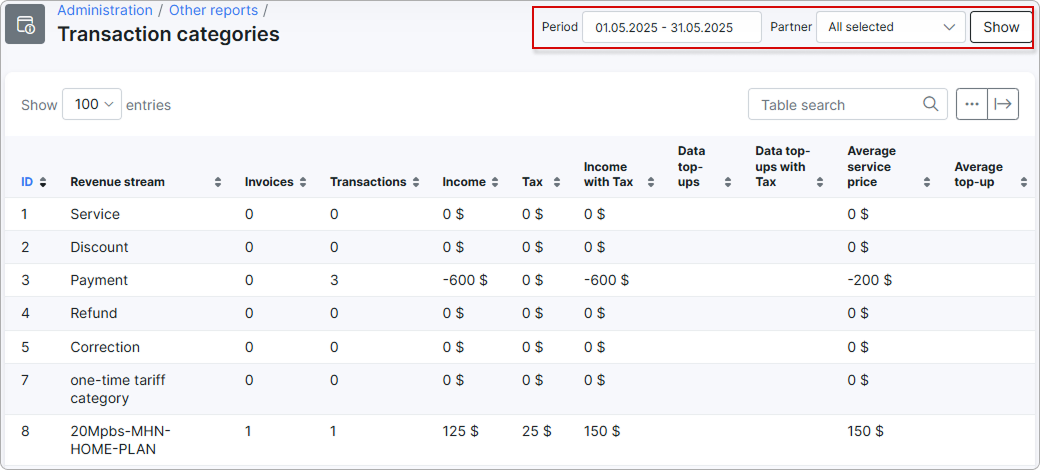
Both filters at the top of the page narrow the data; the report is empty until you click Show.
- Period — date range the report is calculated for. Both bounds are inclusive. Standard range presets (This month, Last month, and so on) are available from the picker. The default is the first day of the current month through the last day of the current month.
- Partner — limits the result to transactions of customers belonging to the selected partners. Multi-select; the default is All selected. If your admin account is bound to a single partner, that partner is enforced automatically and cannot be widened. See Inter-Partner Invoicing handling for the special rules that apply when a partner has IPI enabled.
After adjusting the filters, click Show to refresh the table.
¶ Table
Each row is one transaction category from the system catalog. Every category produces a row even if it had no activity in the period — the row simply shows zeros. Click any column header to sort by that column.
| Column | Description |
|---|---|
| ID | Internal ID of the transaction category. |
| Revenue stream | Name of the transaction category as configured in the system. |
| Invoices | Number of distinct invoices in this category that contained at least one transaction in the selected period. |
| Transactions | Number of transaction lines in this category for the selected period. Both DEBIT lines (charges) and CREDIT lines (refunds, credit notes) are counted — see How values are calculated. |
| Income | Net income before tax for the category, in system currency. Negative when credits exceed debits in the period. |
| Tax | Net tax collected on the category. |
| Income with Tax | Net income including tax. Equal to Income + Tax. |
| Data top-ups | Net income before tax, restricted to transactions linked to a data top-up. Left blank for categories where no top-up transactions occurred. |
| Data top-ups with Tax | Net income with tax, restricted to top-up transactions. Left blank for categories without top-ups. |
| Average service price | Typical billed amount per transaction line in the category, with tax. Calculated as Income with Tax divided by Transactions. Shows 0.00 when the category has no transactions in the period. |
| Average top-up | Typical top-up size per top-up transaction, with tax. Calculated as Data top-ups with Tax divided by the number of top-up transactions. Left blank for categories without top-ups. |
¶ How values are calculated
Every numeric column is computed from the transaction date that sits inside the selected period — the invoice's creation date does not matter. Transactions that have been deleted from the system are excluded.
A transaction is either a DEBIT (a charge that adds to revenue) or a CREDIT (a refund, credit note, or correction that subtracts from revenue). The report nets the two together, so every income column is net of refunds and credits, never gross.
¶ Invoices
Counts how many distinct invoices in the category had at least one matching transaction in the selected period. An invoice with three transactions in the same category counts once.
¶ Transactions
Counts every matching transaction line — DEBIT and CREDIT lines together. A category with one €100 charge and one €100 refund shows Transactions = 2.
¶ Income
For each transaction the report uses price × quantity (the line subtotal before tax):
- Sum the line subtotals of DEBIT transactions in the category for the period.
- Subtract the sum of line subtotals of CREDIT transactions in the same category and period.
A negative Income means credits outweighed debits in this category.
¶ Tax
For each transaction the tax portion of a line is total − price × quantity — the actual tax amount written into that transaction, whatever rate was applied at the time. It is not recomputed from a fixed tax rate.
- Sum the tax portion of DEBIT transactions in the category for the period.
- Subtract the sum of the tax portion of CREDIT transactions.
¶ Income with Tax
Sum of total of DEBIT transactions minus sum of total of CREDIT transactions. Equal to Income + Tax.
¶ Data top-ups and Data top-ups with Tax
These two columns repeat the Income and Income with Tax calculations, but restricted to top-up transactions only. A transaction is treated as a top-up if it is linked to a data add-on (capped or burst data purchase) or to a pending top-up record — regardless of which category the transaction itself sits in.
Top-up transactions are also counted inside the regular Transactions, Income, and Income with Tax columns. The data-top-up columns are an additional split, not a deduction.
¶ Average service price
Income with Tax divided by Transactions, rounded to two decimals. Shows 0.00 when the category has no transactions. Because Transactions counts both debits and credits, a category whose charges and refunds cancel out can show a low or zero average even though there was real activity.
¶ Average top-up
Data top-ups with Tax divided by the number of top-up transactions, rounded to two decimals. Left blank when the category has no top-ups.
The Tax column reflects what was actually written into each transaction at billing time. If a transaction was issued at a different effective rate than the current tax setting, the report shows the historical figure, not a recomputation.
¶ Inter-Partner Invoicing handling
Inter-Partner Invoicing (IPI) is the mechanism where one partner internally invoices another partner. To prevent these internal flows from inflating the totals, the report applies special rules:
- No partner selected (or only non-IPI partners selected) — customers belonging to any partner that has IPI enabled are excluded from the report. Only "external" revenue is counted.
- A partner with IPI enabled is selected — only one customer is included for that partner: the customer configured as the IPI receiver in the partner's settings. A yellow alert appears above the table:
Inter partner invoicing is enabled for selected partner. The report is shown only for customer (#{id} {login}) who was assigned as the receiver of Inter Partner Invoice.
This split lets you inspect either external revenue (the default) or the internal IPI flow for a specific partner — never the two mixed together. If totals look lower than you expect, check whether you actually want to include an IPI partner explicitly.
¶ How to read a row
For each category, four pieces of information explain its result:
- Volume — Invoices and Transactions show how busy the category was.
- Net revenue and tax — Income, Tax, and Income with Tax show the financial result, already net of refunds and credits.
- Top-up share — compare Data top-ups with Tax against Income with Tax to see how much of the category's revenue came from data top-ups versus regular service lines.
- Pricing shape — Average service price compared with Average top-up shows whether customers in this category typically pay for a recurring service or are buying smaller add-ons.
A row where Transactions is greater than zero but Income with Tax is zero indicates that debits and credits cancelled out — for example, a charge that was fully refunded inside the same period.
¶ Export
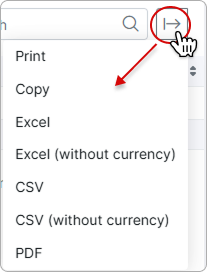
Use the export button  above the table to copy the data or download it. Available formats:
 Print, Copy, Excel, Excel (without currency), CSV, CSV (without currency), PDF. The "without currency" options strip currency formatting from money columns, which is useful when feeding the file into another system.
¶ Important notes
- Transaction date is the cutoff. A transaction dated inside the selected period counts even if its invoice was issued earlier (or later).
- Deleted transactions are excluded from the Invoices count and from every total.
- Empty categories are still listed with zeros, so the row layout stays stable across reporting periods.
- Partner filter excludes IPI partners by default. If figures look lower than expected, check whether you need to include an IPI partner explicitly.
- Top-up columns are an additional split. Top-up transactions are also included in the regular Transactions, Income, and Income with Tax columns — they are not subtracted from them.