¶ SLA Monitoring (Config)
¶ Overview
SLA (Service Level Agreement) monitoring groups open tickets into color-coded buckets based on how long they have been waiting for a response, so your support team can see which tickets are overdue. The SLA Monitoring section of the configuration defines the waiting times behind those colors and how often the monitoring page reloads its data.
To open the settings, go to Config → Helpdesk → SLA Monitoring:

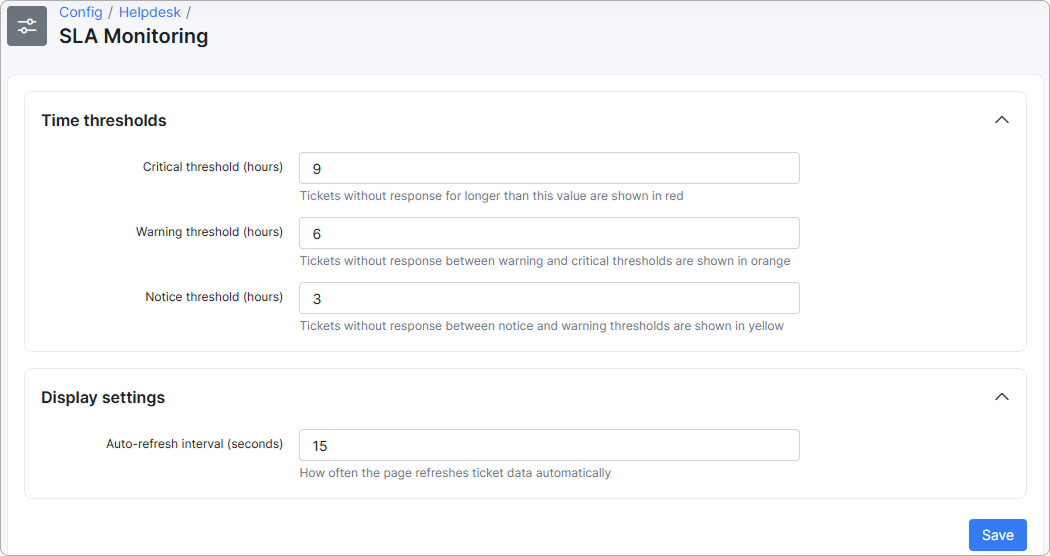
After changing any value, click Save.
¶ Time thresholds
The Time thresholds section sets how long a ticket may wait without a response before it moves into the next color. All three values are in hours and are counted from the moment the ticket last went without a response.
| Field | Description |
|---|---|
| Critical threshold (hours) | Tickets without response for longer than this value are shown in red. |
| Warning threshold (hours) | Tickets without response between the warning and critical thresholds are shown in orange. |
| Notice threshold (hours) | Tickets without response between the notice and warning thresholds are shown in yellow. |
Set the values in ascending order — notice first, then warning, then critical. For example, with a notice threshold of 3, a warning threshold of 6, and a critical threshold of 9, a ticket turns yellow after 3 hours without a response, orange after 6 hours, and red after 9 hours.
Tickets that have been waiting less than the notice threshold are not highlighted, so a low notice threshold marks more tickets for attention.
¶ Display settings
The Display settings section controls how the SLA monitoring page behaves while it is open.
| Field | Description |
|---|---|
| Auto-refresh interval (seconds) | How often the page refreshes ticket data automatically. |
A short interval keeps the page close to real time, which suits a wall-mounted dashboard. A longer interval reduces the number of requests to the server.
¶ Related pages
- SLA monitoring (how the color-coded monitoring page is used day to day)
- Tickets
- Miscellaneous (general) ticket configuration
- Ticket automation