¶ Statistics
¶ Internet
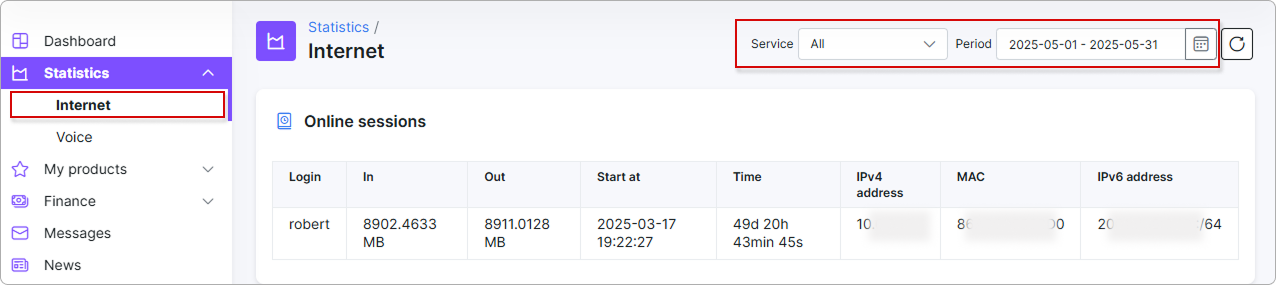
It displays statistics of the services the customer has subscribed to and uses. In the top-right corner of the screen, customers can choose which service will be displayed in the statistics and specify the period of time to display statistics for.
Customer online sessions display all details used for statistical purposes.
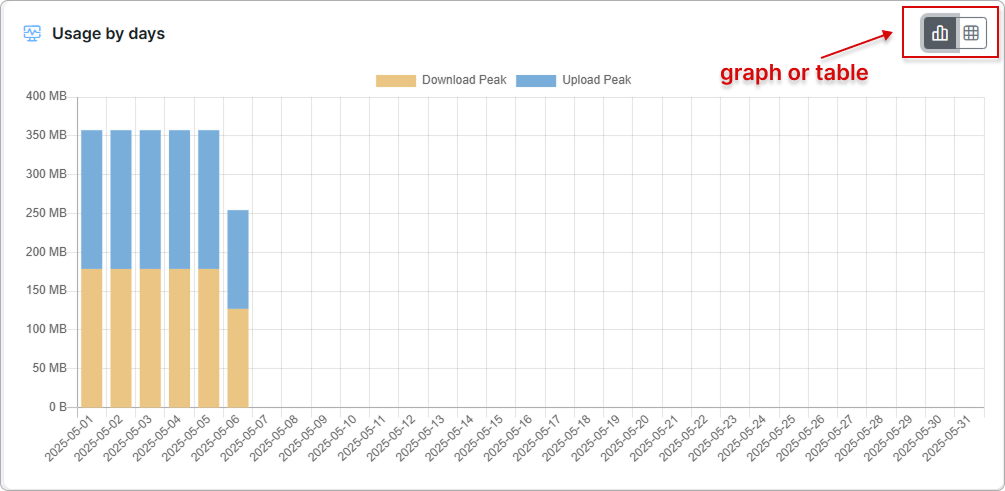
You can view the daily usage statistics as either a graph or a table:
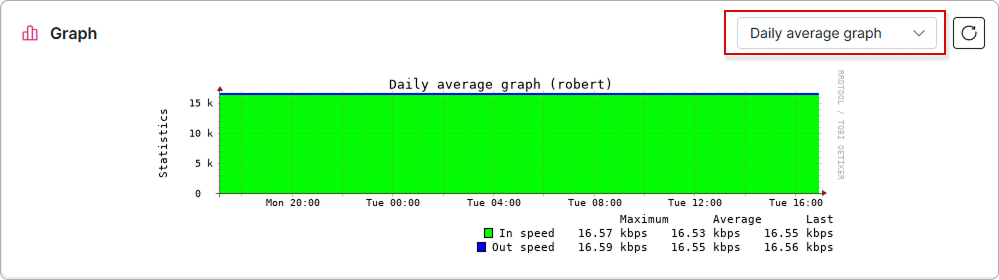
Average graph data is available by hour, day, week, month, and year:
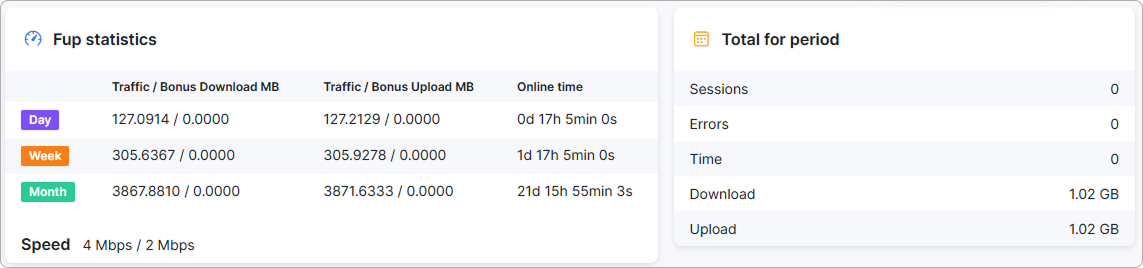
The following displays the FUP (Fair Usage Policy) statistics, speed, and total data for the specified period:
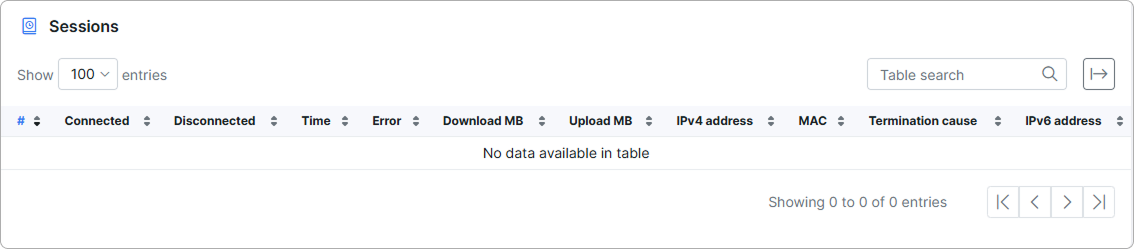
Session details are presented at the bottom of the page:
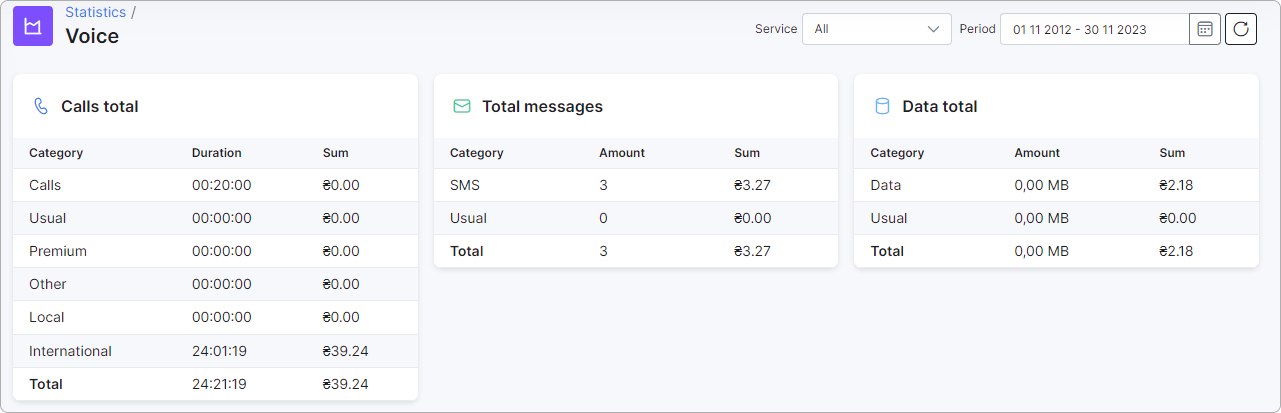
¶ Voice
Here you can view all statistics for the customer's voice services for the specified period, including totals for calls, messages, and data: