¶ Troubleshooting Radius server
¶ Step 1
Firstly make sure that the router is accessible from Splynx and vice versa that the router can "reach" Splynx. In Splynx you can check the reachability with a ping status from Splynx to the router:
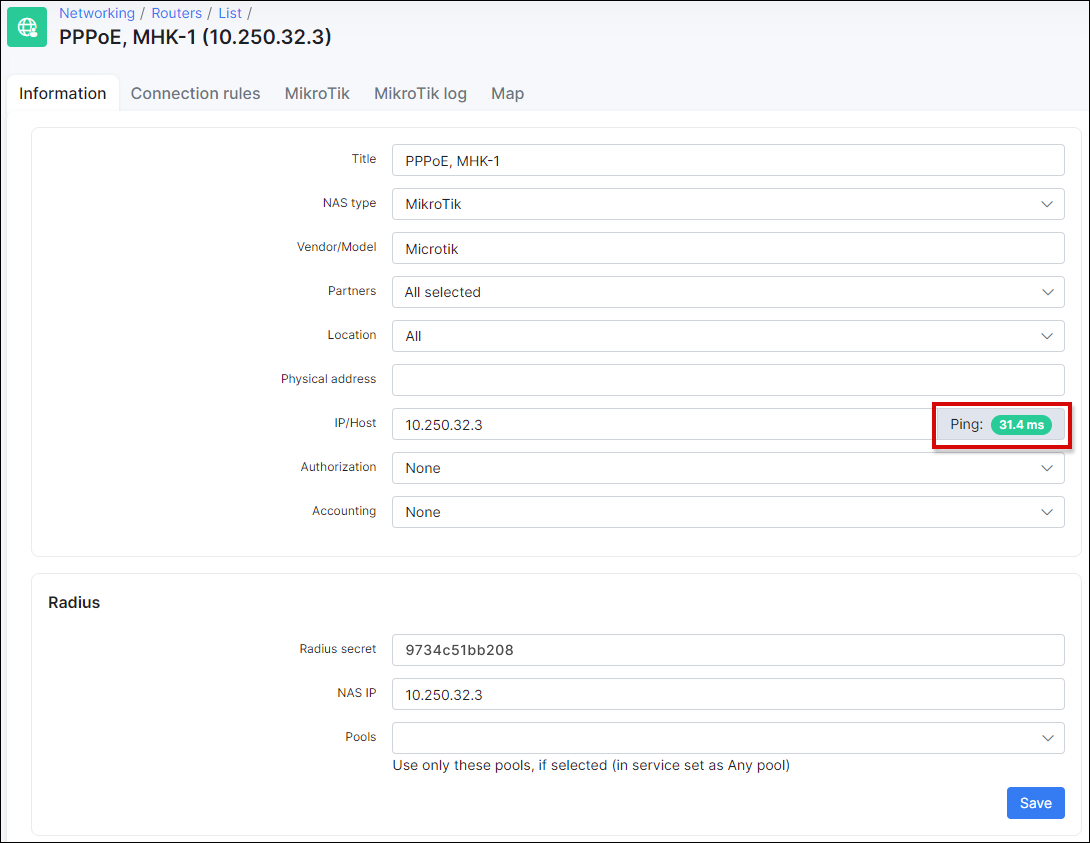
This troubleshooting step is only suitable when the "ping" (ICMP traffic) is not restricted between the router and the Splynx server (If ICMP echo responses are not blocked/filtered on the firewall).
Also read these manuals and compare the settings to ensure that setup is correct:
-
in case of using PPPOE with Radius follow this: PPPoE with RADIUS
-
in case of using DHCP with RADIUS (IPoE) follow this: DHCP with RADIUS
¶ Step 2
Compare RADIUS parameters on the router information tab in Splynx and on the Mikrotik router under the RADIUS menu:
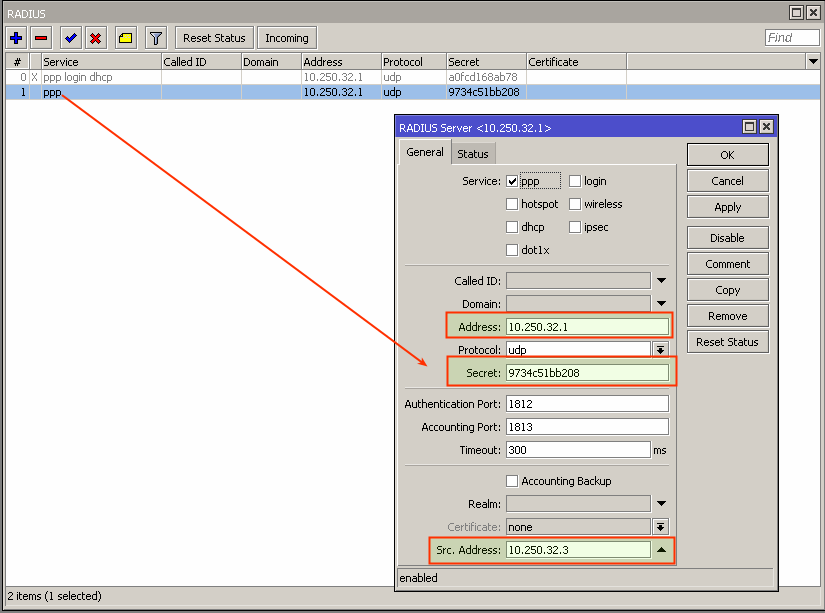
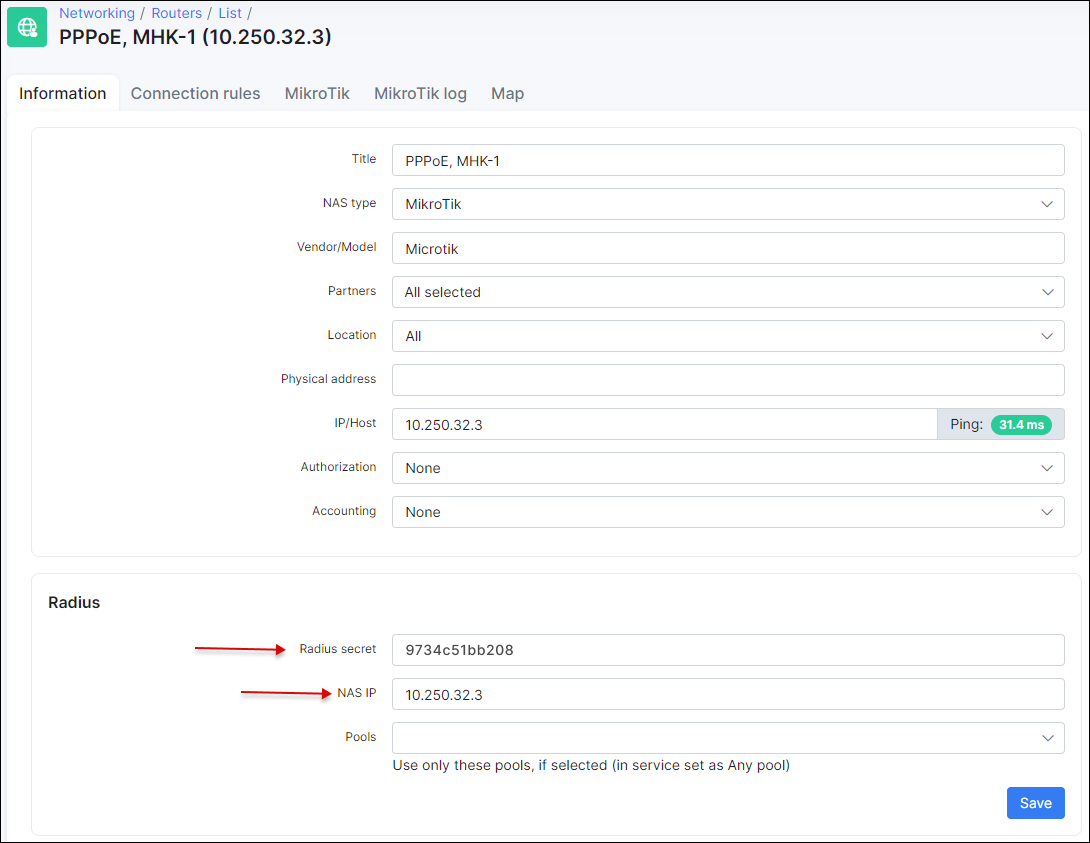
The Secret field on the Mikrotik should be the same as field Radius secret on the router in Splynx.
The IP Address field on the Mikrotik should be filled with Splynx' IP.
The Src.Address field on Mikrotik should be filled with the router IP or can be 0.0.0.0.
The NAS IP field in Splynx is the real source IP address for RADIUS packets. It is recommended that in the Radius settings of the Mikrotik router Src. address equals NAS IP in Splynx.
Also make sure that you don't have multiple RADIUS servers configured with same services:
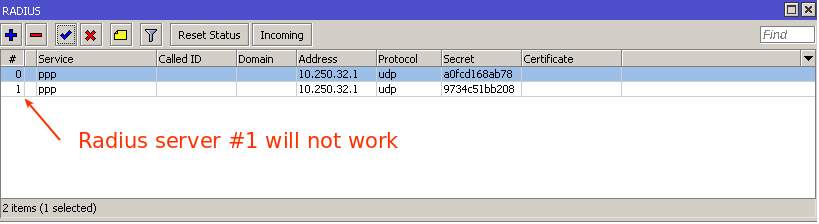
You can have multiple RADIUS servers however each server should be configured with unique services, for example: RADIUS server #1 configured for DHCP service, RADIUS server #2 configured for PPP service.
¶ Step 3
Check the firewall and ports. RADIUS is transported over UDP on ports 1812 (authorization) and 1813 (accounting) so these 2 ports should be open on the router as well as port 3799 (radius incoming) should be open and not blocked by any firewall rules/filters.
¶ Step 4
Inspecting of logs.
By default Splynx writes logs into 2 files: coa.log and short.log that you can find in the folder /var/www/splynx/logs/radius on CLI or via the web interface, navigate to Administration → Logs → Files and search these 2 files.
The short.log file will display all records of login attempts, the reason of disconnection. For example:
28/02 14:54:16:7361 - [Login               ] - [10.2.32.109    ] - Accept
28/02 14:54:23:3637 - [C38F676DB15B        ] - [10.2.36.0      ] - Log in
28/02 14:54:18:6727 - [C38F676DB15B        ] - [10.2.33.190    ] - Log off -  (NAS-Error)
28/02 14:54:19:3702 - [26117AB65E2B        ] - [10.2.36.0      ] - Log off -  (Session-Timeout)
28/02 14:54:22:7030 - [-Unknown-           ] - [10.250.74.24   ] - Reject (ATTR + IP accept) - [26117AB65E2B] -> [service1] Customer not found
28/02 14:54:23:2525 - [26117AB65E2B        ] - [10.2.33.190    ] - Reject (Attribute accept) - [FCACAF943B30] -> [service1] Customer is not active
28/02 14:54:14:2384 - [user                ] - [10.2.36.247    ] - Reject - [B4FBE4ACFCC2] -> [service1] Customer is already online
28/02 14:54:21:2743 - [265798031           ] - [               ] - [card] Accept
28/02 14:54:21:5017 - [265798031           ] - [10.5.28.211    ] - [card] Log in
28/02 15:10:35:6518 - [voucher-login       ] - [10.1.0.202     ] - [card] Log off -  (User-Request)
28/02 15:11:05:2315 - [serieALRClM4sj      ] - [               ] - Reject card - [4FFE0CD555D3] -> [hap-lite] Password is incorrect
This file contains the following information: date and time, login of the service, IP and description of action.
Descriptions of records:
- Accept - The Splynx server received the Radius-Access Request packet from the Router and a Radius Access-Accept packet was sent back. Customer was successfully authenticated. Please note, if MS-CHAP is used for authentication, we can see
Accepthere even if password is incorrect; - Log in - The Splynx server received the Radius Accounting-Start packet from Router;
- Log off - The Splynx server received the Radius Accounting-Stop packet from Router;
- Reject - The Splynx server received the Radius Access-Request packet from Router and Radius Access-Reject was sent back. Customer was not authenticated;
- Reject (Attribute accept) - The Splynx server sent the Radius Access-Accept packet to Router with the IP address from the Splynx service. Customer was authenticated on the router with a session time limit = Config → Networking → Radius → Error session time limit. IP address was added into the Address list
Reject_xon the router; - Reject (ATTR + IP accept) - The Splynx server sent the Radius Access-Accept packet to the Router with an IP address from the Splynx Reject pool (Config → Networking → Radius → Reject IP x). Customer was authenticated on the router with session time limit = Config → Networking → Radius → Error session time limit. IP address was added into the Address list
Reject_xon the router; - [card] Accept - The same as Accept but for Prepaid vouchers.
- [card] Log in - The same as Log in but for Prepaid vouchers.
- [card] Log off - The same as Log out but for Prepaid vouchers.
- Reject card - The same as Reject but for Prepaid vouchers.
In the case of authentication errors or logging off, the reasons are shown in the radius logs under Administration → Logs → Files → radius/short as well as in the customer statistics under sessions (enable the "Termination cause" column).
 NOTE: Disconnection reasons in the
 short.log like Admin-reset or Lost-carrier are not related to Splynx and should be investigated on the network.
In the coa.log you can find records that can help you with troubleshooting of issues with disconnection, plan change etc. If Splynx sends a CoA packet, it will be logged here:
2021-10-07 07:15:02 - echo "User-Name = mike, Framed-IP-Address = 192.168.200.218, NAS-IP-Address = 10.250.32.3" | /usr/bin/sudo /usr/bin/radclient 10.250.32.3:3799 disconnect "9734c51bb208" > /dev/null &
2021-10-07 07:15:49 - echo "User-Name = mike, Framed-IP-Address = 192.168.200.28, NAS-IP-Address = 10.250.32.3" | /usr/bin/sudo /usr/bin/radclient 10.250.32.3:3799 disconnect "9734c51bb208" > /dev/null &
2021-10-07 07:20:10 - echo "User-Name = mike,Framed-IP-Address = 192.168.200.108,  NAS-IP-Address = 10.250.32.3 , Mikrotik-Rate-Limit = \"5000000/5000000 0/0 0/0 0/0 5 5000000/5000000\"" | /usr/bin/sudo /usr/bin/radclient 10.250.32.3:3799 coa "9734c51bb208" > /dev/null &
2021-10-07 07:32:46 - echo "User-Name = mike, Framed-IP-Address = 192.168.200.137, NAS-IP-Address = 10.250.32.3" | /usr/bin/sudo /usr/bin/radclient 10.250.32.3:3799 disconnect "9734c51bb208" > /dev/null &
2021-10-07 07:45:37 - echo "User-Name = mike, Framed-IP-Address = 192.168.200.5, NAS-IP-Address = 10.250.32.3" | /usr/bin/sudo /usr/bin/radclient 10.250.32.3:3799 disconnect "9734c51bb208" > /dev/null &
2021-10-07 11:45:10 - echo "User-Name = mike,Framed-IP-Address = 192.168.200.5,  NAS-IP-Address = 10.250.32.3 , Mikrotik-Rate-Limit = \"10000000/10000000 0/0 0/0 0/0 5 1000000/1000000\"" | /usr/bin/sudo /usr/bin/radclient 10.250.32.3:3799 coa "9734c51bb208" > /dev/null &
In this part of the coa.log you can see that Splynx has sent some CoA packets to disconnect a user and change the speed of the connection.
The Splynx Radius server consist of 2 services: splynx_radd and freeradius. Both of them have different debugging procedures and show different information. Let’s start with the splynx_radd debug:
To enable debug mode for splynx_radd, navigate to Config → Networking → Radius (Advanced) and enable debug (change the level of debug to get more or less detail in the log):
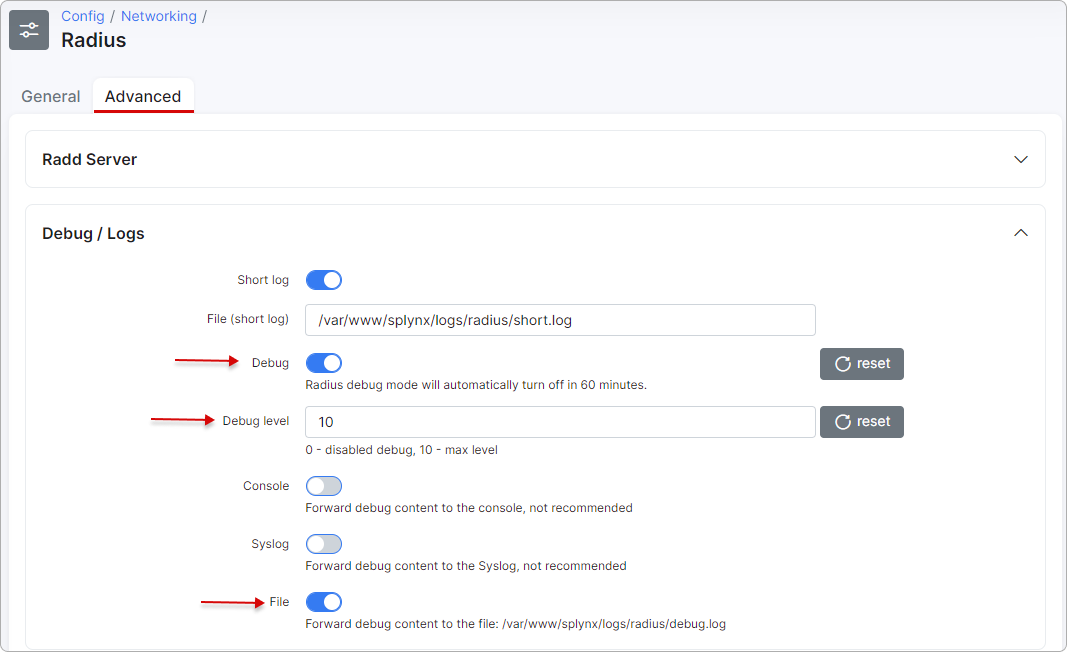
Apply new settings immediately by saving and restarting the Radius server.
To restart Radius server use the button at the bottom of the same page (Config → Networking → Radius (Advanced)), or enter command in SSH:
service splynx_radd restart
Now we can check the debug file. It is also accessible from the CLI of Linux Splynx server:
/var/www/splynx/logs/radius/debug.log
The best way to check the file is by using the tail command:
tail -f /var/www/splynx/logs/radius/debug.log
Once the debug is completed, remember to switch the debug off the same way it was switched on, save and restart the radius server again. (To avoid massive radius rebug files forming)
If splynx_radd debug doesn’t show us the desired results, we can also run freeradius daemon in debug mode and see if any packets are received by Radius server.
Run CLI commands to get output into the file:
service freeradius stop && freeradius -Xxxx | tee Debugxxx.log
Wait for 2-5 minutes to collect some data and stop execution of this command by using Ctrl+C and start freeradius in a regular mode:
service freeradius start
If the freeradius daemon returns an error after the last command run this:
killall freeradius; service freeradius restart
If you don’t see any debug messages when a customer tries to connect to the Mikrotik Router, it means that your router's radius packets are not reaching the Splynx Radius server at all. You need to verify networking, routing and NAT settings of the network.
The use of a VPN in any case where connectivity or NATting is an issue is highly recommended and can be setup natively in Splynx via the GUI:
Our guide on OpenVPN and OpenVPN client / Routes
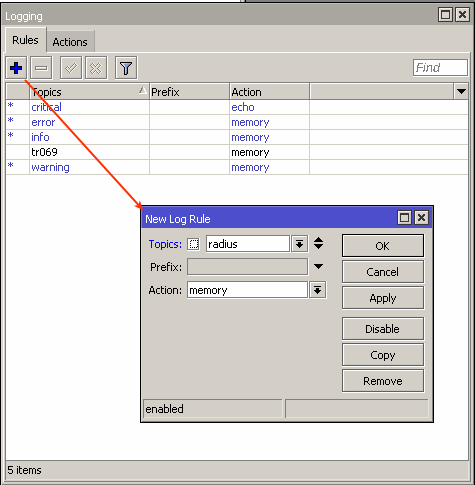
On the Mikrotik Router there is also the ability to run extended debug to see exactly what the router is sending to the Radius server:
¶ Video tutorial
This is a guide illustrating how to troubleshoot communication between your router (Mikrotik example) and the Radius server (Splynx).
Video tutorial for Radius configuration:
For more information on how RADIUS works, please visit Radius Wikipedia or FreeRADIUS Wiki
