¶ Ping and Traceroute
¶ Overview
Ping and Traceroute are valuable tools for troubleshooting network issues on behalf of your clients. With Splynx, it has become even easier to perform these checks for routers, internet services, CPE, or when responding to tickets.
Ping is primarily used to check if a remote server or device is responding and measures the time it takes for a signal (or packet) to travel to that remote server and back to your computer. It's a way to verify if a remote system is reachable and to assess the responsiveness or speed of the connection.
Traceroute is used to trace the route that data packets take from your computer to a destination (like a website or server). It shows you the individual servers or routers that the data passes through along the way. Traceroute helps you understand the path your data follows and can be useful for diagnosing network issues and understanding the network infrastructure between your computer and the destination.
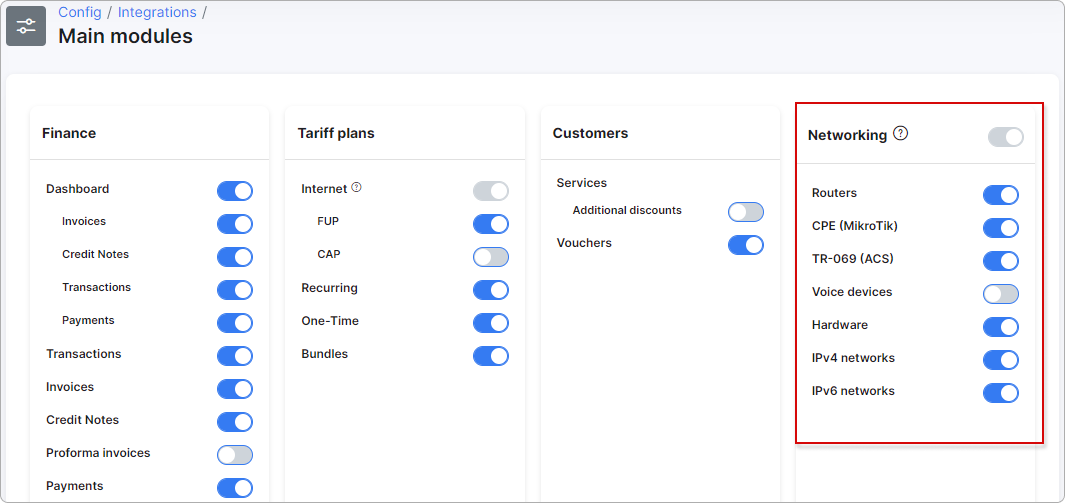
 Please ensure that you have all the necessary networking sections enabled under Config → Integrations → Main modules:
¶ Routers
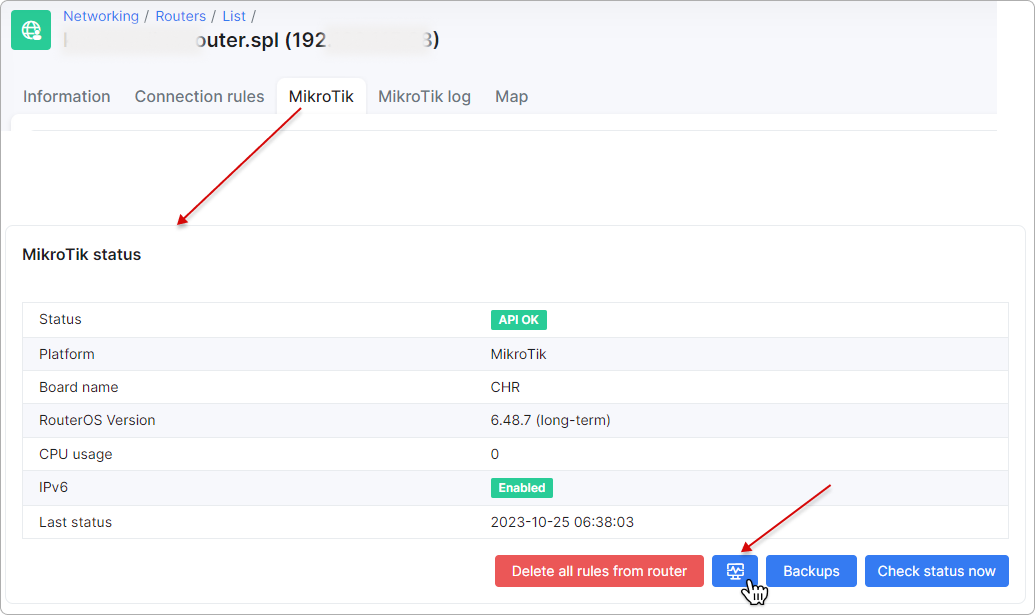
In the Networking section, you can conduct Ping and Traceroute checks for your routers. For this example, we'll use a MikroTik router. Navigate to the MikroTik tab of the specific router and, at the bottom of the MikroTik status section, click the Ping & Traceroute button:
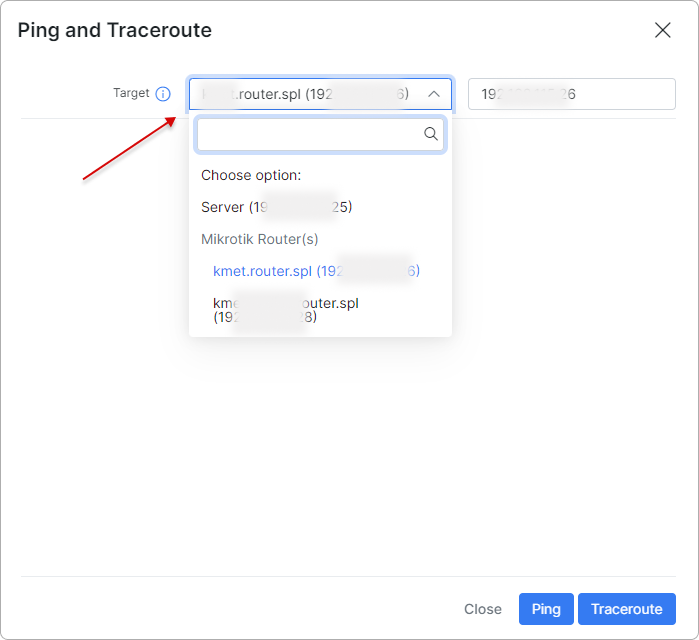
In the newly opened window, select the target server or router from the list or manually enter it:
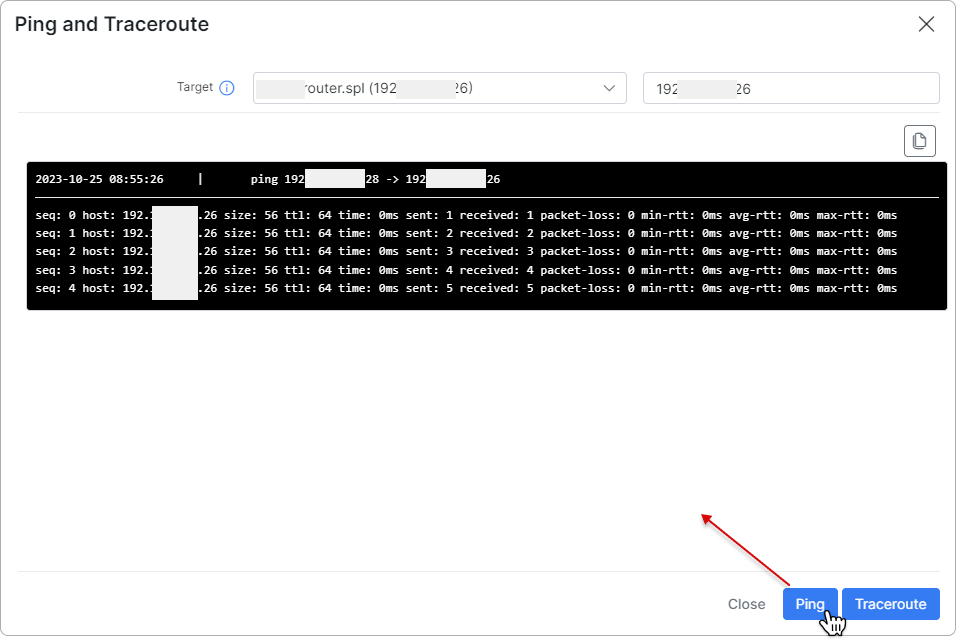
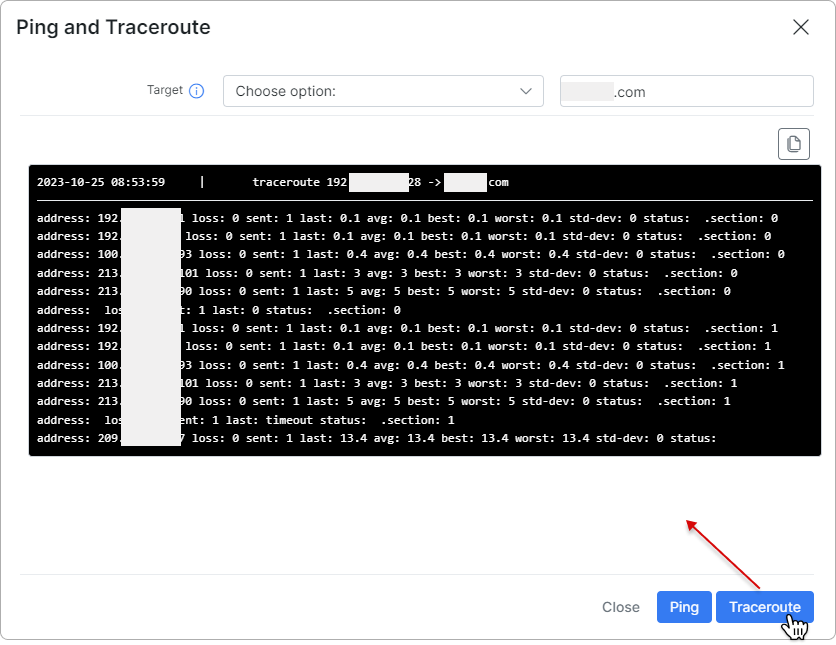
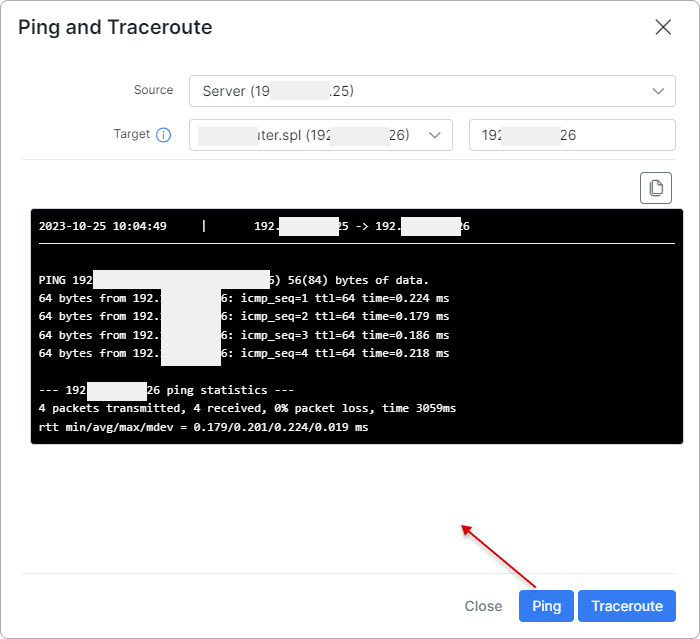
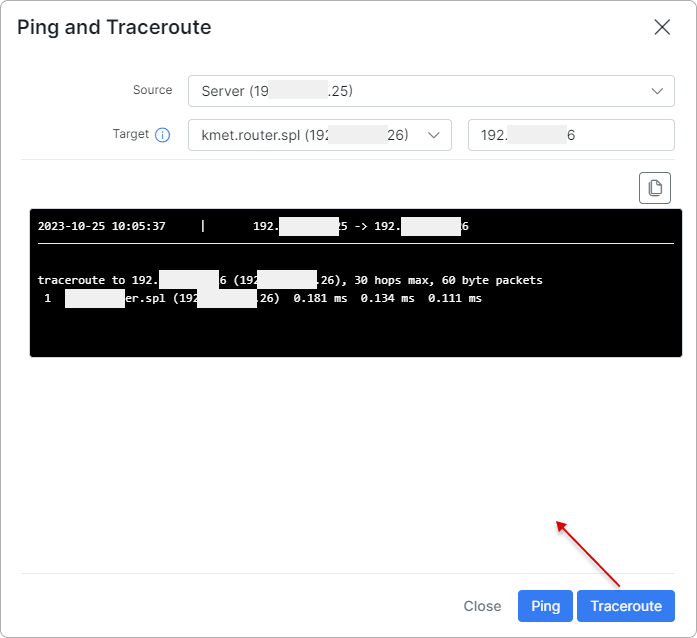
To perform a ping check, click the Ping button; for traceroute checks, select the Traceroute button below. The date and time of the check will be displayed at the top of the output area:
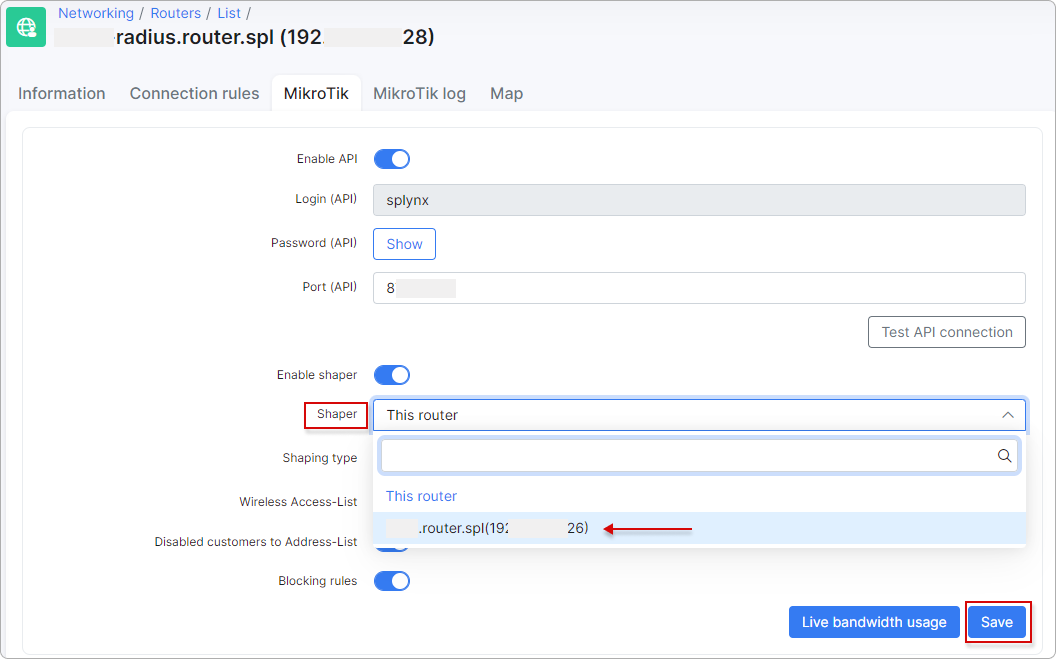
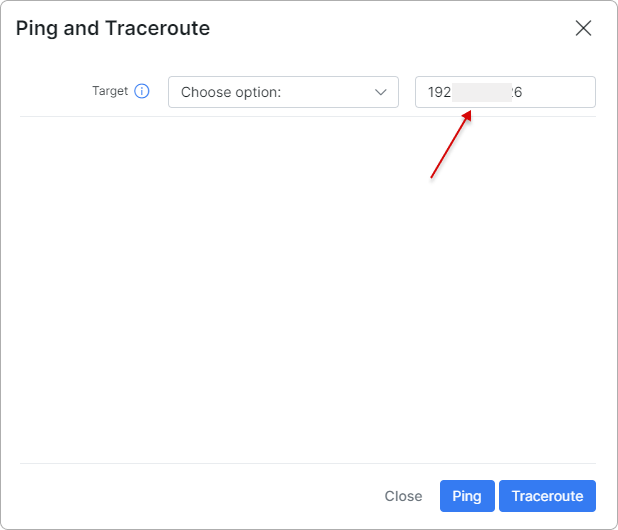
If you choose a router other than This router from the list in the Shaper field, the IP of the selected router will be automatically inserted into the Target field after clicking the Ping & Traceroute button:
¶ Customer Premises Equipment (CPE)
 Please ensure that you have CPE(MikroTik) enabled under Config → Integrations → Main modules:
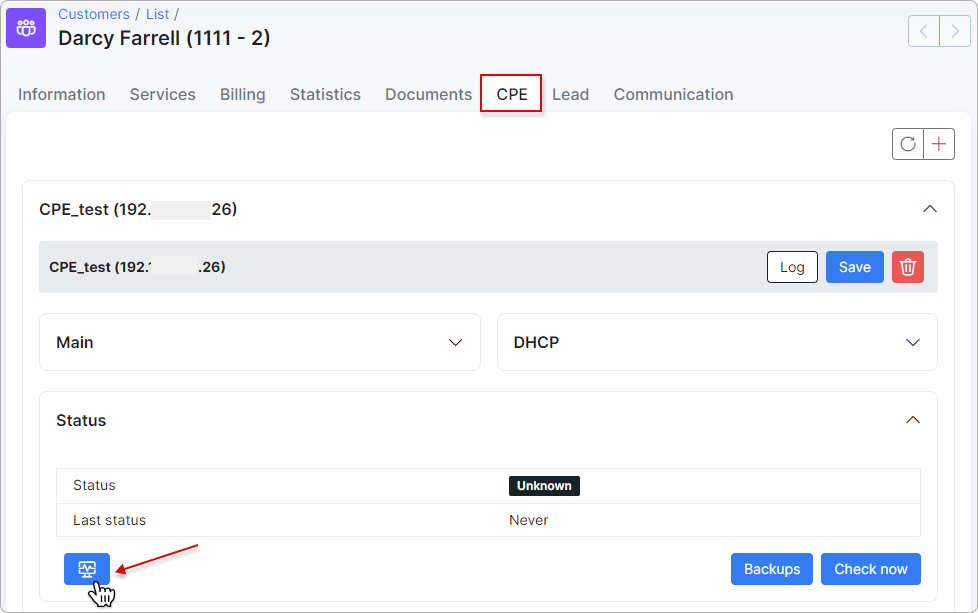
To check the status of Ping and Traceroute for the CPE associated with a specific customer, navigate to the CPE tab in the customer's profile and click the Ping & Traceroute button located in the Status section:
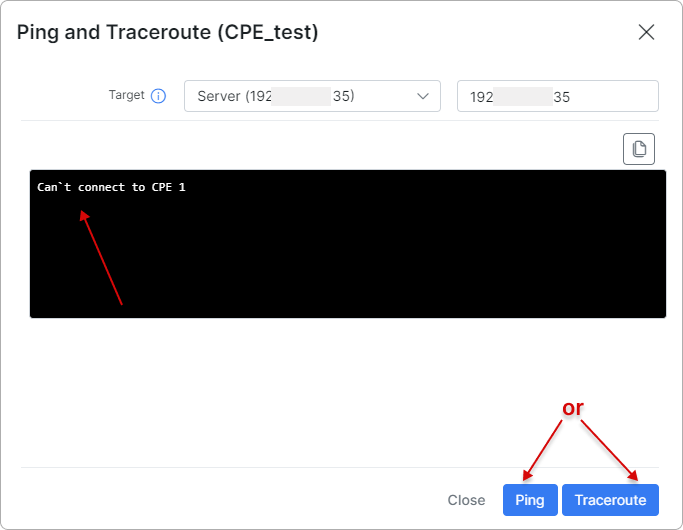
If an issue occurs, you will receive a message stating that connecting to the specified target is impossible:
¶ Internet services
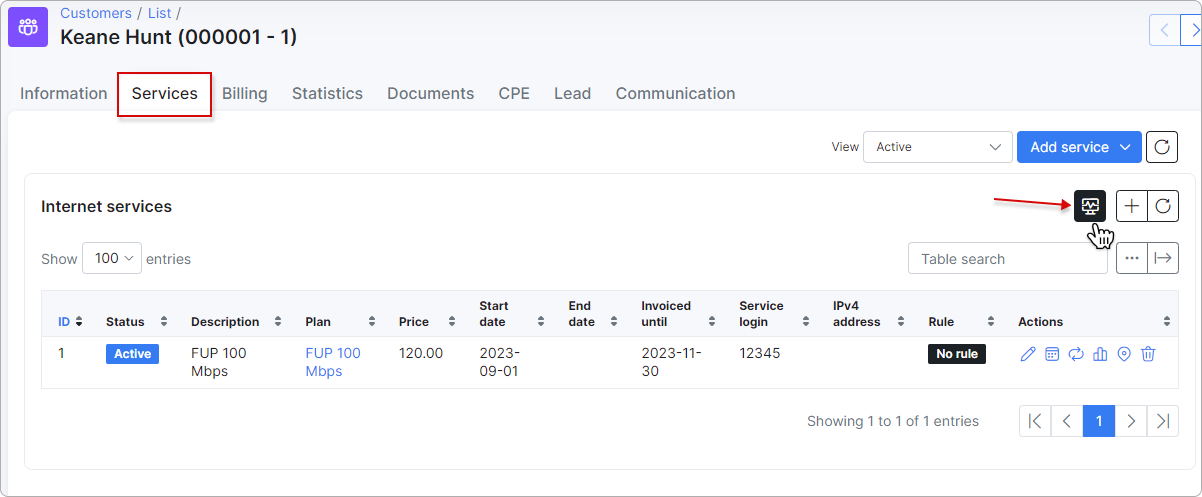
To check the devices connected to the customer's internet services, navigate to the Services tab in the customer's profile. At the top of the Internet Services section, click the Ping & Traceroute button, as shown below:
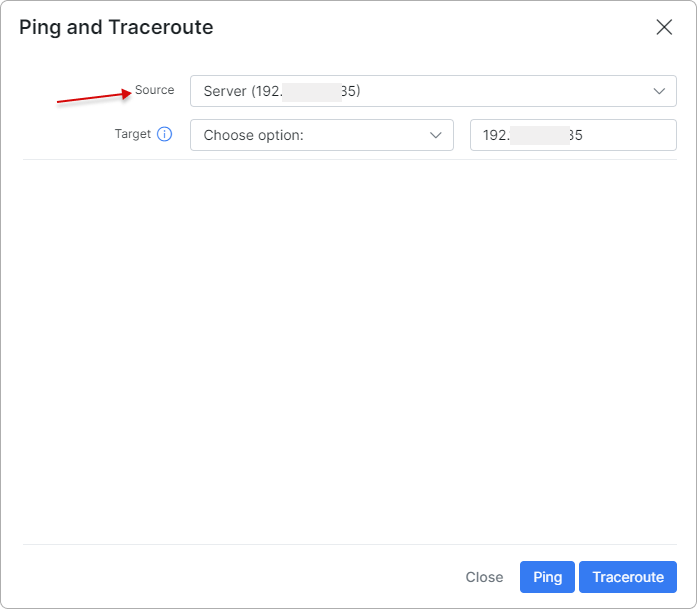
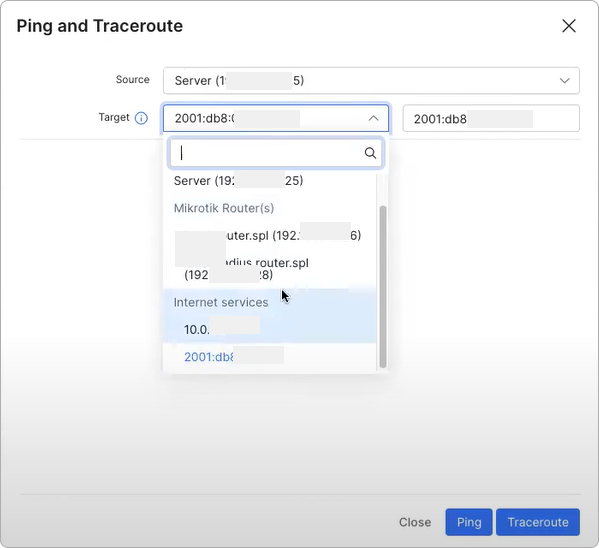
You can select both the Target and the Source here:
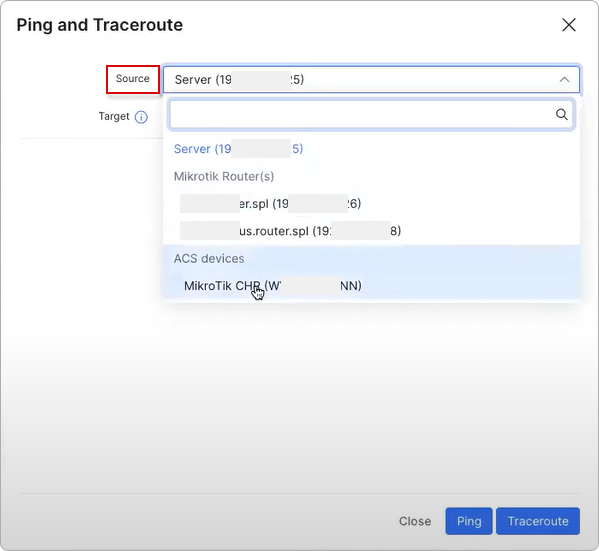
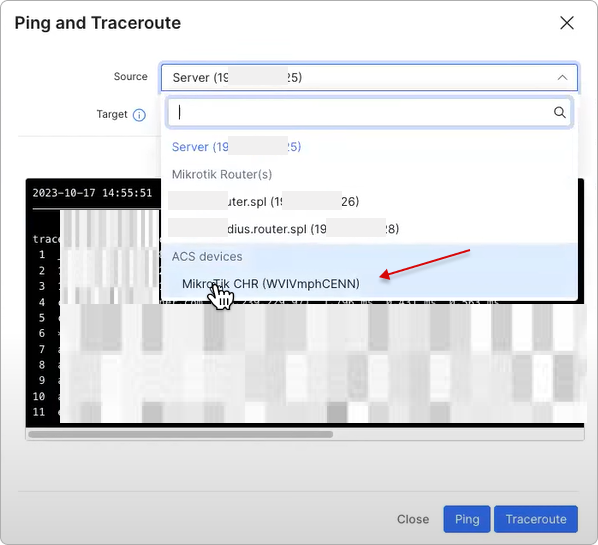
In addition to internet service IPs, ACS devices and CPE devices will also be included in the list if applicable:
After selecting the Source and the Target, proceed by clicking the Ping or Traceroute button below:
If you need to check ACS devices, the Run Diagnostics window will appear.
Here, you can edit the Host, DSCP, Data Block Size, Number of Repetitions, and Timeout. Finally, click the Run button:
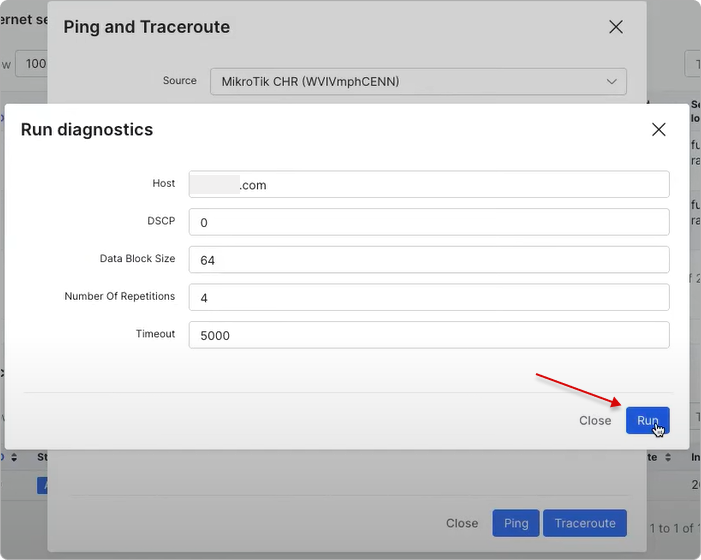
The result will appear in the same window, and you may follow the link to access the Diagnostics tab of the specified ACS device, where you will find results for Ping or Traceroute:

¶ Tickets
To rapidly assess the customer's device response, we have integrated Ping and Traceroute features directly within the support tickets. Simply click the Ping & Traceroute button located above within the ticket to perform the checks:

You can then copy the result as text or as an image:
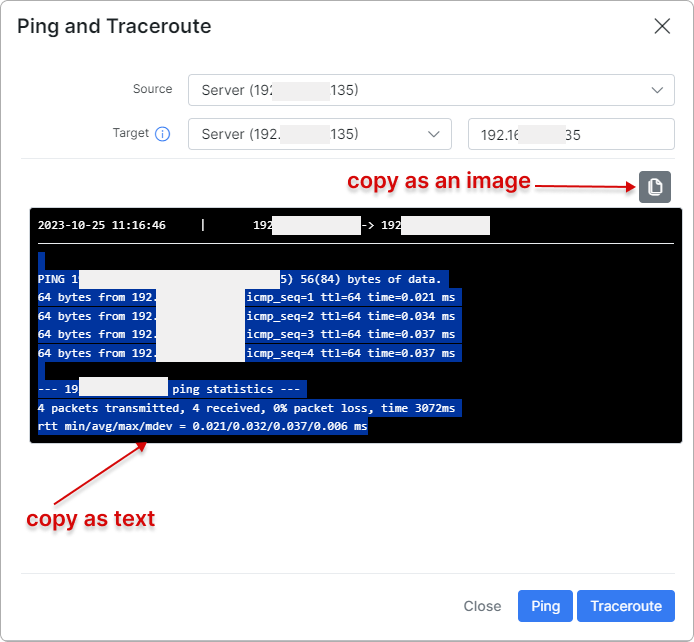
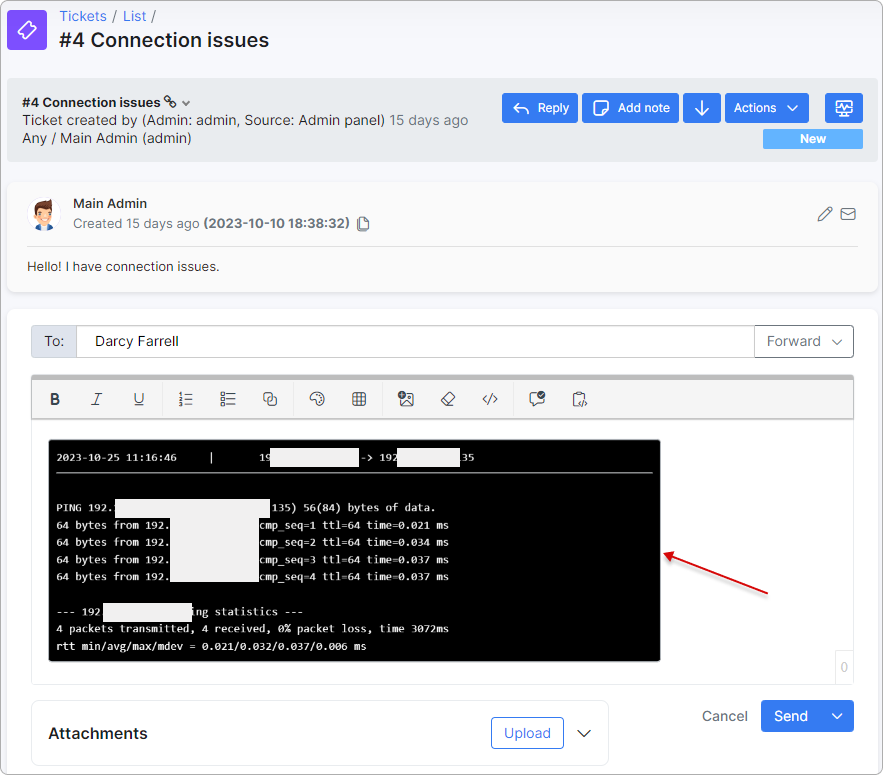
The copied text or image of the Ping/Traceroute check results can be easily pasted when replying to a customer's ticket or in any other location where you need it.
For additional information, please read the following:
