¶ Device view
¶ Menu sections
In the device control menu, we can find the following sections:
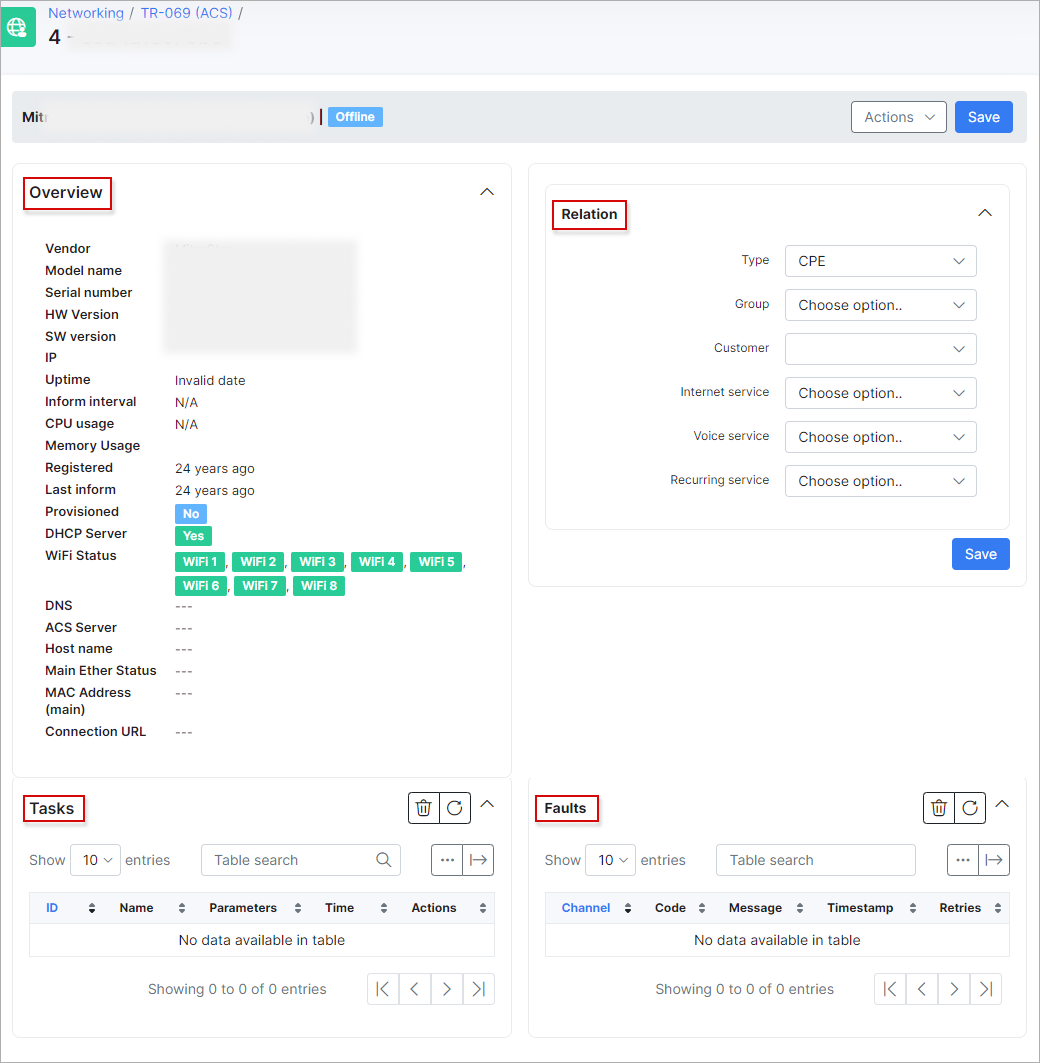
On the Overview tab you can see basic parameters like uptime, IP, CPU usage etc.
On the Relation tab you can set type of device (type should be created under Config → Networking → TR-069 → Types), group (should be created under Config → Networking → TR-069 → Groups as well) also the customer and their services can be linked to this device.
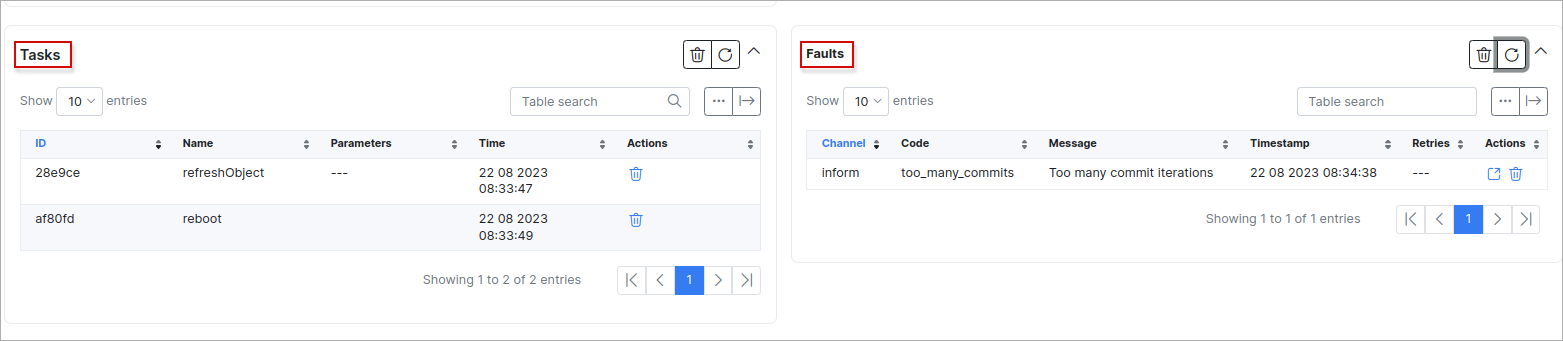
In the Tasks section, you will see the pending tasks (like you run a wi-fi password change and task will be created).
In the Faults section, you will see tasks what were executed with an errors.
The Activity section displays recent activity related to the device.
¶ Actions
Click the Actions button to access the following options:
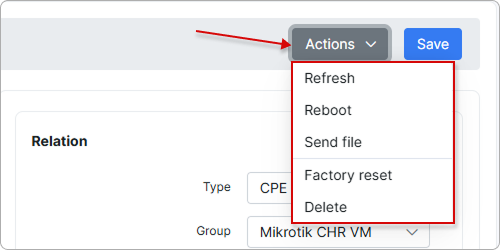
- Refresh - you can use it to refresh device connection between ACS and Splynx;
- Reboot - remotely reboot a device;
- Send file - send some file to a device;
- Factory reset - reset device to its factory settings;
- Delete - delete this device from the ACS (if the device is connected to the network it will appear in the list again. First, disable the TR-069 client on the device if you do not want this device to appear on the ACS again).
¶ Additional tabs
At the bottom of the page there are additional tabs related to the router: WAN, LAN, WiFi, NAT, Firewall, Diagnostics, Activity.
The Activity tab is always available; the other tabs are displayed only when the ACS server returns data for them, so the set of tabs varies by device model and its supported features.
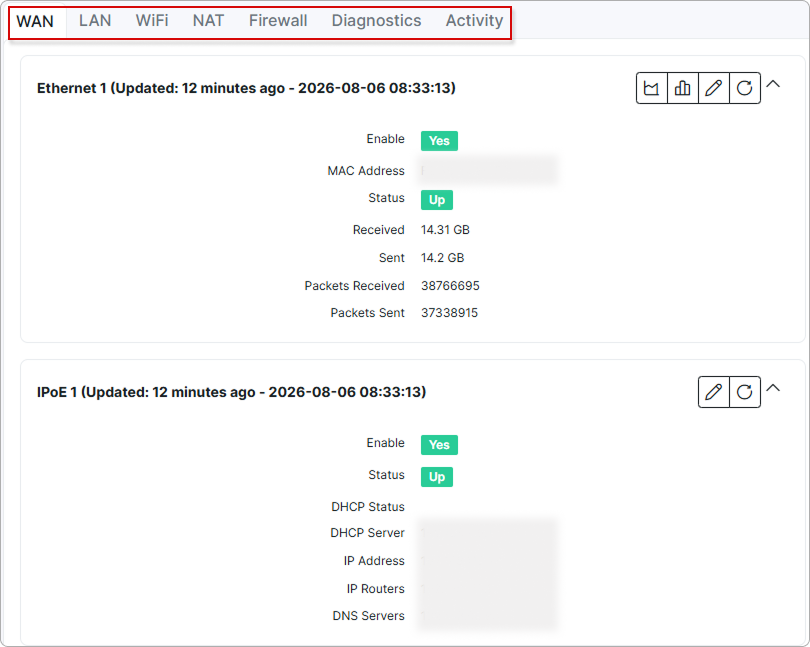
Switch between available tabs to configure the necessary parameters. As an example we can change a DHCP server parameters:
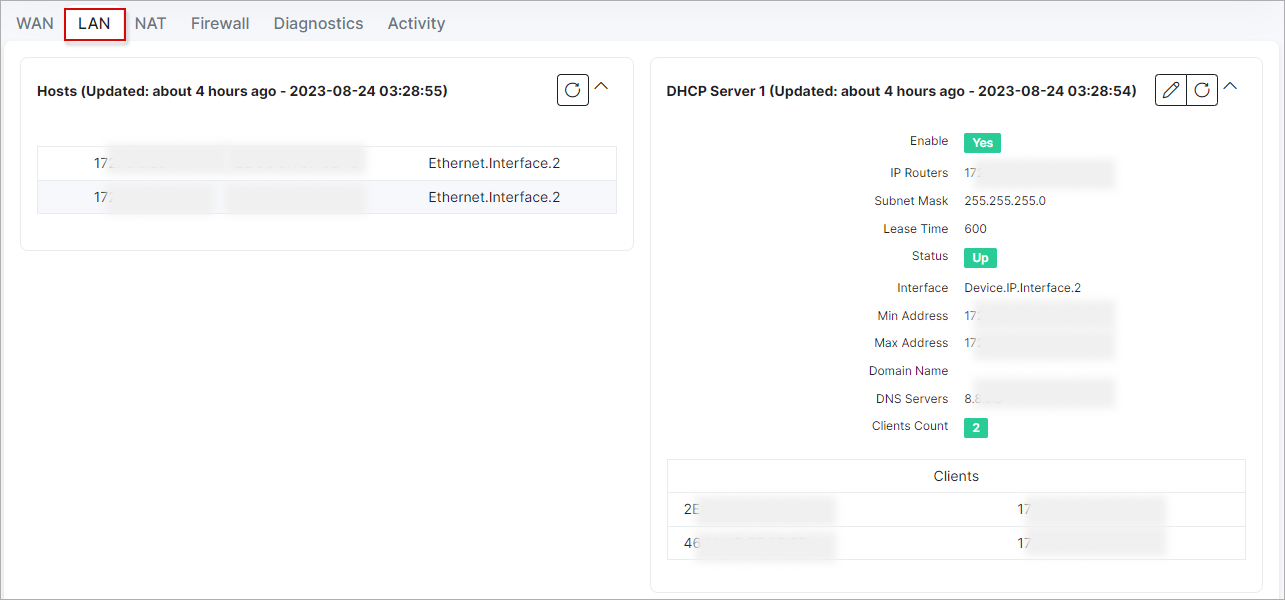
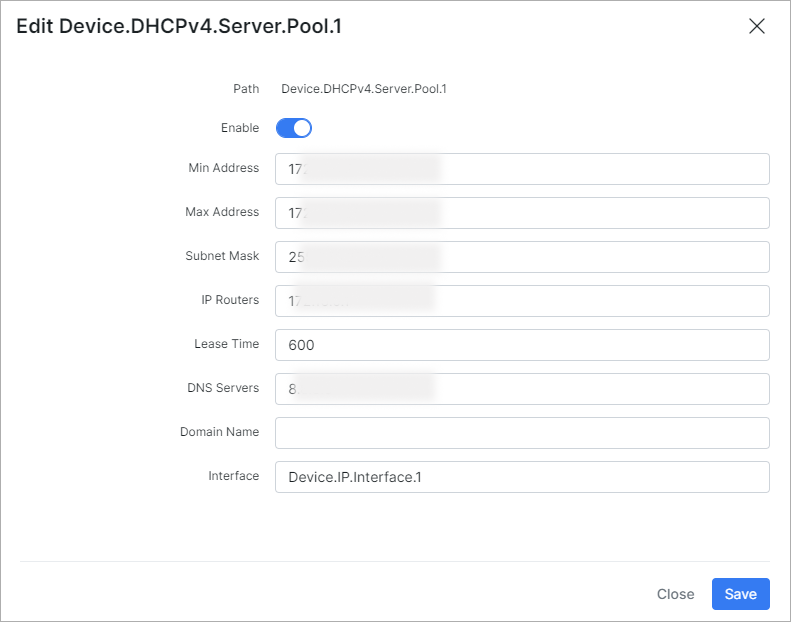
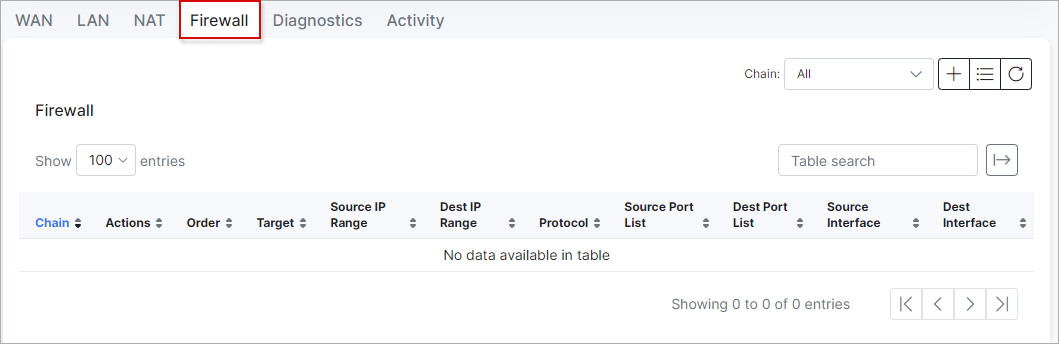
or add some firewall rules right here:
The Wi-Fi tab displays a list of clients connected to the Wi-Fi access point, along with attributes such as the MAC address, hostname, connection time, RSSI signal level, throughput, and more.

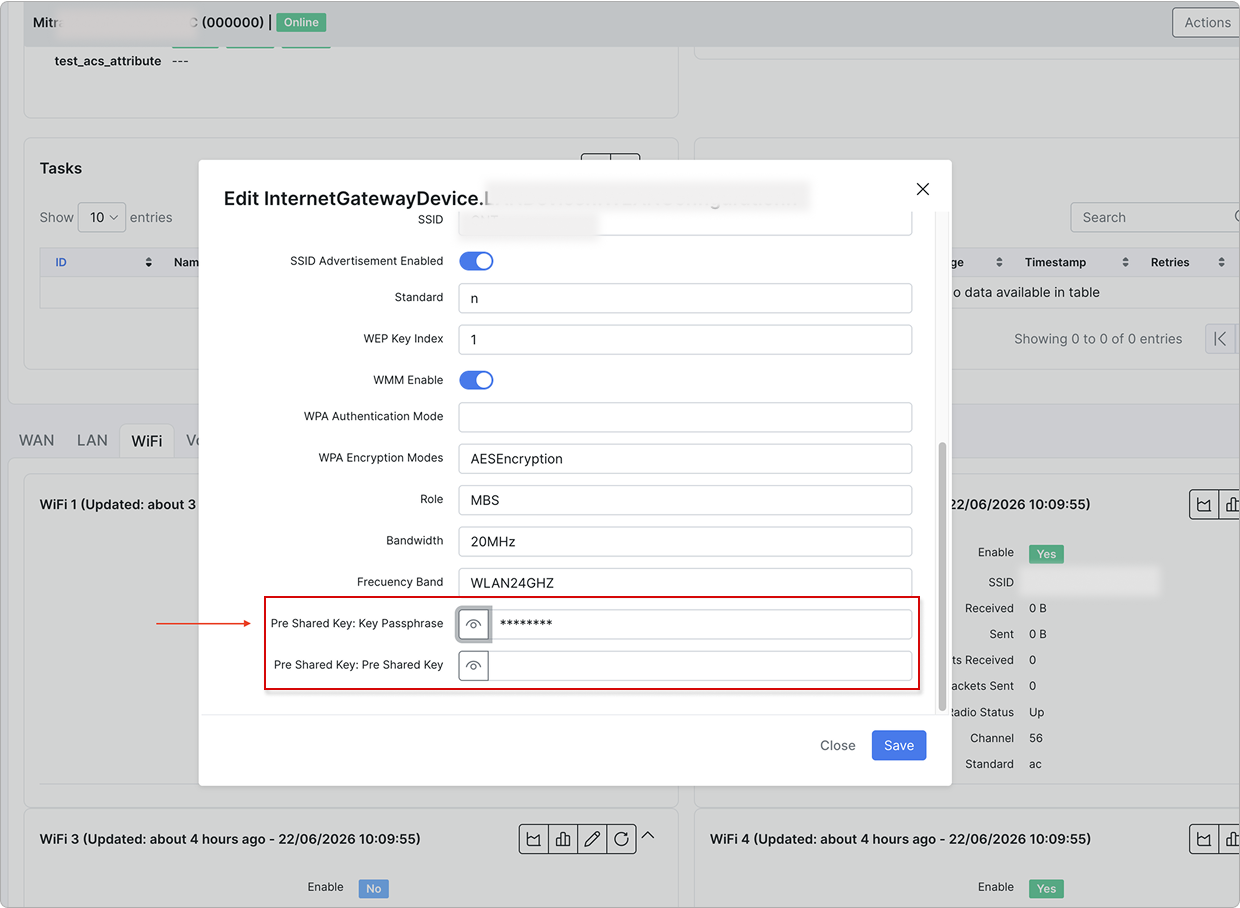
You can change passwords when editing a Wi-Fi device:
On the Diagnostics tab you can find such diagnostic tools as: ping, traceroute, upload/download statistic and wifi-analyzer:
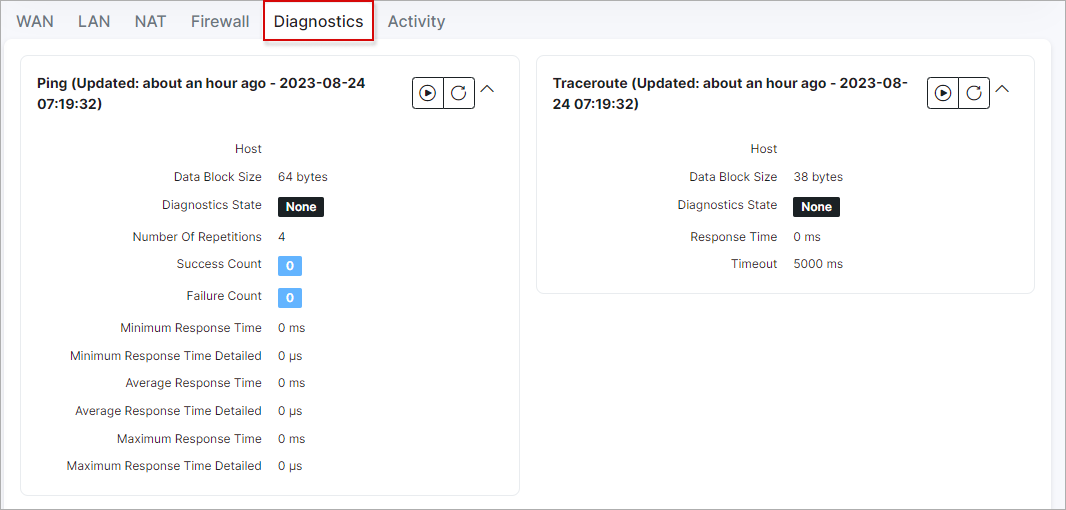
To run some diagnostic tool click on Run button near each tool.
 This menu can differ depending on a device, e.g. Mikrotik router can be without а Wi-Fi module.
Wi-fi analyzer shows all the available wi-fi networks and its signal strength.
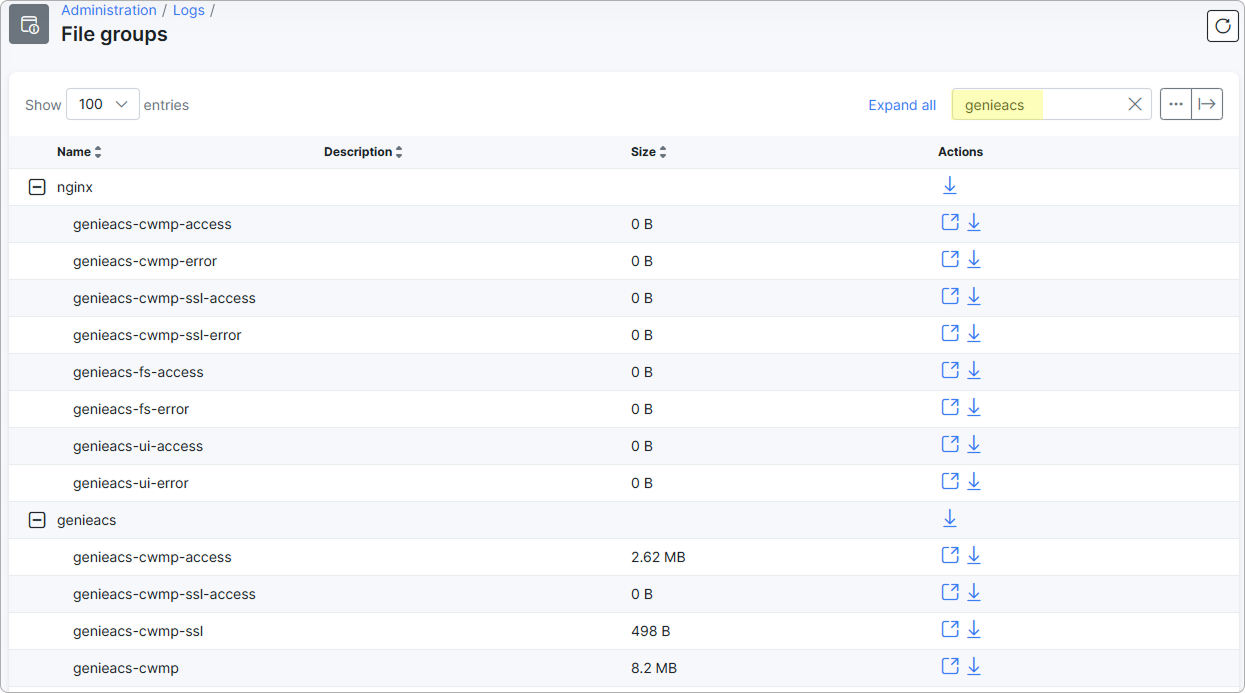
Debug logs can be found under Administration → Logs → File groups; find files by word genieacs: