¶ SLA monitoring
¶ Overview
The SLA monitoring page gives support teams a real-time view of open tickets grouped by how long they have been waiting, so tickets approaching or breaching their SLA (Service Level Agreement) stand out at a glance. Tickets are sorted into four color-coded time buckets, from Under 3 hours (green) to Over 9 hours (red), letting you focus on the most overdue tickets first.
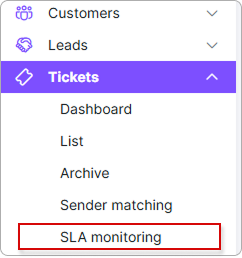
To open the page, navigate to Tickets → SLA monitoring:
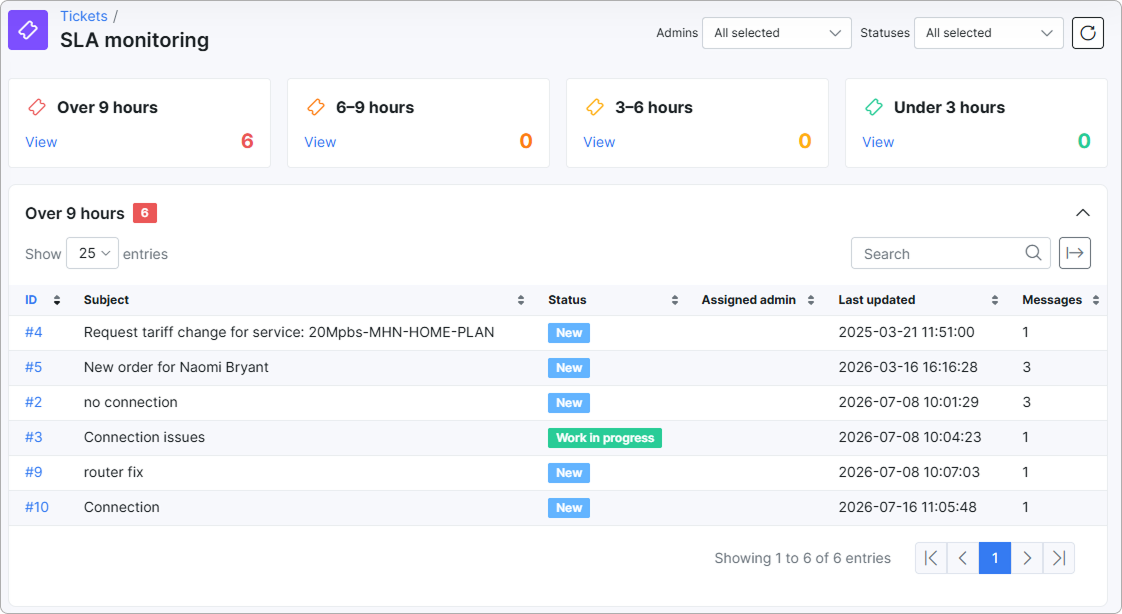
The page opens on a dashboard with four summary cards at the top and an expandable ticket table for each bucket below.
¶ SLA time buckets
Every open ticket is placed into one of four buckets based on how long it has gone without an update. Each bucket is shown as a summary card with its own color and a count of the tickets it contains:
- Over 9 hours (red) — tickets waiting longer than 9 hours; the most urgent.
- 6–9 hours (orange) — tickets waiting between 6 and 9 hours.
- 3–6 hours (yellow) — tickets waiting between 3 and 6 hours.
- Under 3 hours (green) — tickets waiting less than 3 hours; within a healthy response window.
Each card shows the number of tickets currently in that bucket and a View link that jumps to the matching ticket table lower on the page.

¶ Filters
Two filters and a refresh control at the top of the page let you narrow down which tickets the buckets and tables include:

- Admins — a multi-select dropdown that limits the view to tickets assigned to the chosen administrators. Defaults to All selected.
- Statuses — a multi-select dropdown that limits the view by ticket status. Available options are New, Work in progress, Resolved, Waiting on customer, and Waiting on agent, plus a Select all toggle. Defaults to All selected.
- Refresh button — reloads the page data so the buckets and counts reflect the latest ticket activity.
¶ Ticket table
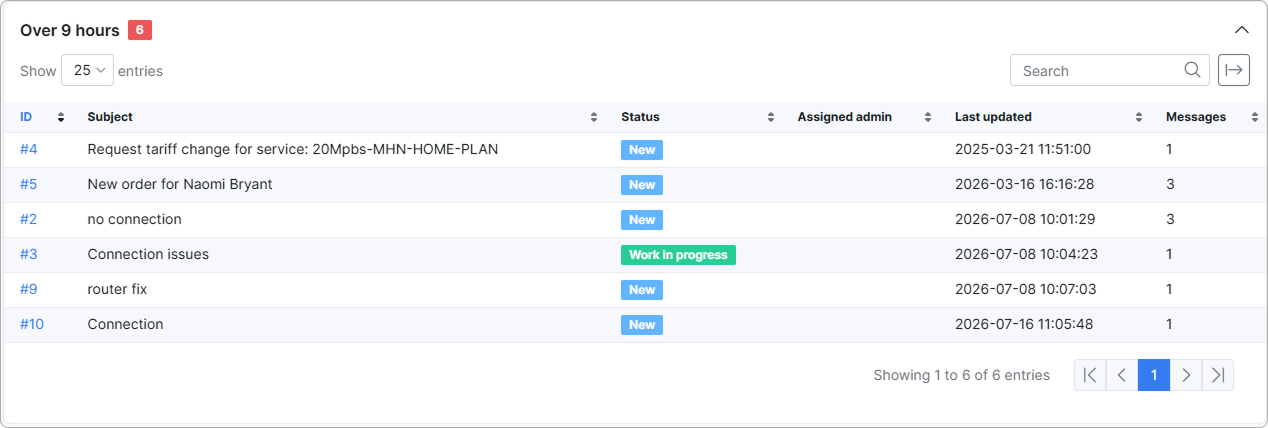
Below the summary cards, each bucket has its own expandable table listing the tickets it contains. Use the chevron on the right of a bucket heading to collapse or expand its table. A bucket with no tickets shows No data available in table.
Each table lists tickets with the following columns:
- ID — the ticket number, shown as a link that opens the ticket.
- Subject — the ticket subject.
- Status — the ticket's current status (for example, New or Work in progress).
- Assigned admin — the administrator the ticket is assigned to.
- Last updated — the date and time of the ticket's most recent update.
- Messages — the number of messages in the ticket.
Each table has its own controls:
- Show entries — sets how many tickets appear per page.
- Search — filters the table by keyword.
- Export button — copies, prints, or exports the table.
- Pagination — moves between pages when a bucket holds more tickets than fit on one page.