¶ Hardware (Monitoring)
- Overview
- Adding a new device
- Actions with devices
- SNMP OID
- Logs
- Graphs
- Backup
- Map
- Customer services
- Notifications
- Related pages
¶ Overview
Using monitoring in Splynx, you can track the status of your network, and if any device goes down, the system automatically notifies the responsible admins via the portal, email, SMS, or any combination of these. Splynx uses SNMP and ping tools to monitor devices.
You can easily perform Ping and Traceroute checks.
¶ Adding a new device
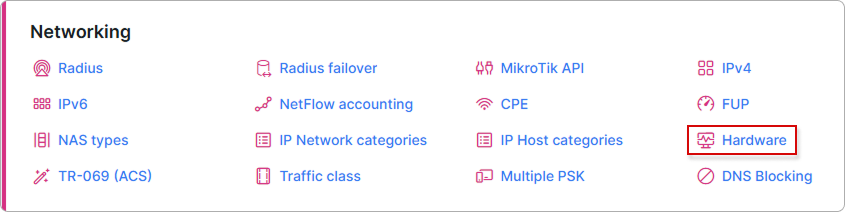
To add a new device, under the Networking section find the Hardware option:
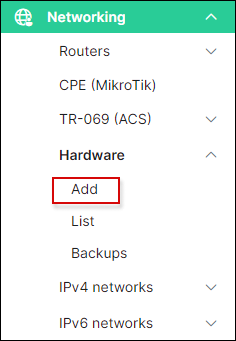
Inside this menu you can add a new device using the Add button, display a list of all devices, view recently selected monitoring devices, and check backups of these devices.
The device list includes an Inventory column showing the inventory item each device is linked to (if any).
Click the Add button to create a new device for the Hardware section:
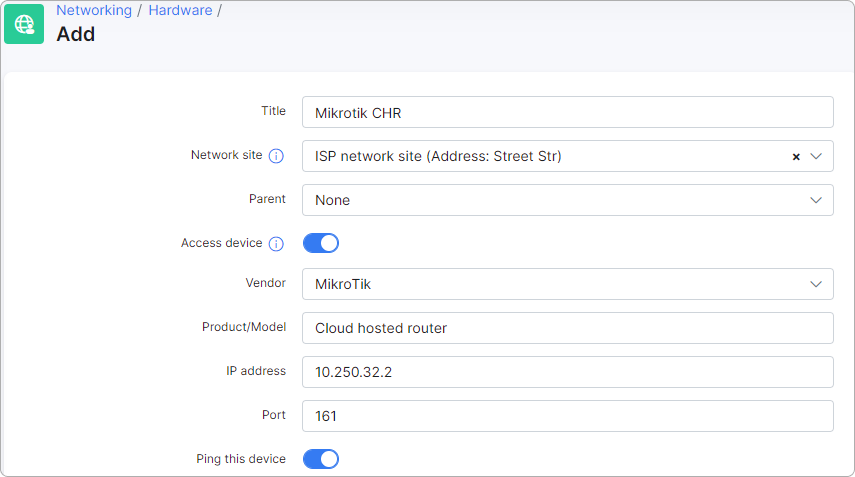
- Title - name of the device;
- Network site - connect to a network site for centralized management of hardware, access devices, and related services;
- Link to inventory - link this monitoring device to an item in the Inventory module, so the same physical unit is tracked in both monitoring and inventory;
- Parent - select a parent device (if it exists). You can build parent-child relationships in Splynx monitoring;
- Access device - enable this toggle to link hardware devices directly within customer services for easier management and connection to network sites.
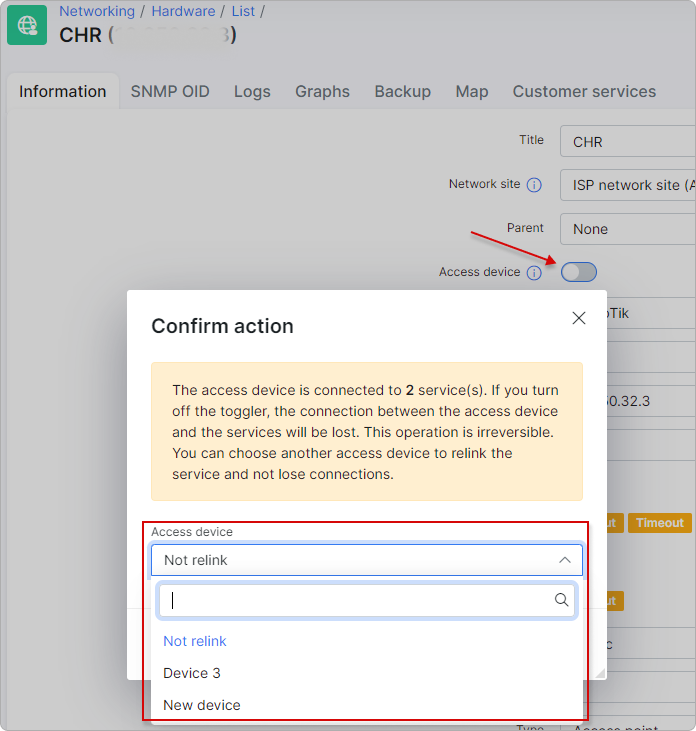
When a hardware device is connected to a service and you disable the toggle, clicking
Saveprompts a confirmation window. This window displays the number of services the device is connected to and offers the option to select another device for linking. If you prefer not to relink the customer services, selectNot relink. To proceed, clickConfirm. The hardware device is then unlinked.
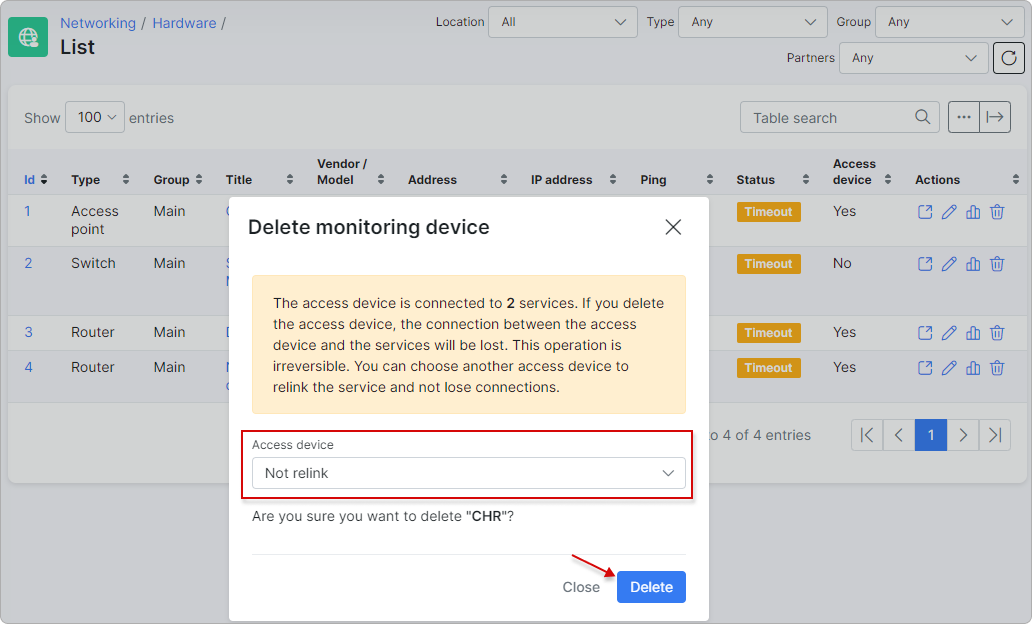
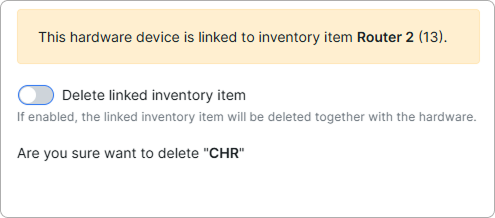
The same applies when you try to delete a connected device. You need to confirm the action:
A hardware device can be linked to only one inventory item, and an inventory item to only one hardware device. If the device is linked to a network site, its inventory item is automatically linked to the same site (and the reverse).
- Vendor - vendor name. You can add more vendors under Config → Networking → Hardware;
- Product/Model - information about the device model;
- IP address - IPv4 address of the device;
- Port - port for the SNMP connection;
- Ping this device - if enabled, Splynx pings the device to track connectivity;
- SNMP Monitoring - if enabled, Splynx monitors the device via SNMP and loads available information. SNMP should also be enabled and configured accordingly on the device;
- SNMP community - define a community. Using
publicis insecure — create a custom community on the device and use it instead; - SNMP Version - select the version (2 is recommended);
- Type - select the type. You can add more types under Config → Networking → Hardware;
- Group - define a group for the monitoring notifications configuration;
- Partners - select the partner that can manage this device;
- Location - set the device location;
- Address - information about the address where the device is installed;
- Send notifications - enable/disable sending notifications when the device goes down/up;
- Delay timer for notification - set a delay in minutes before sending a notification about a status change. If the device is down, Splynx waits 10 minutes and, if the status remains the same, sends a notification.
When the device is up and running, you can see the status:
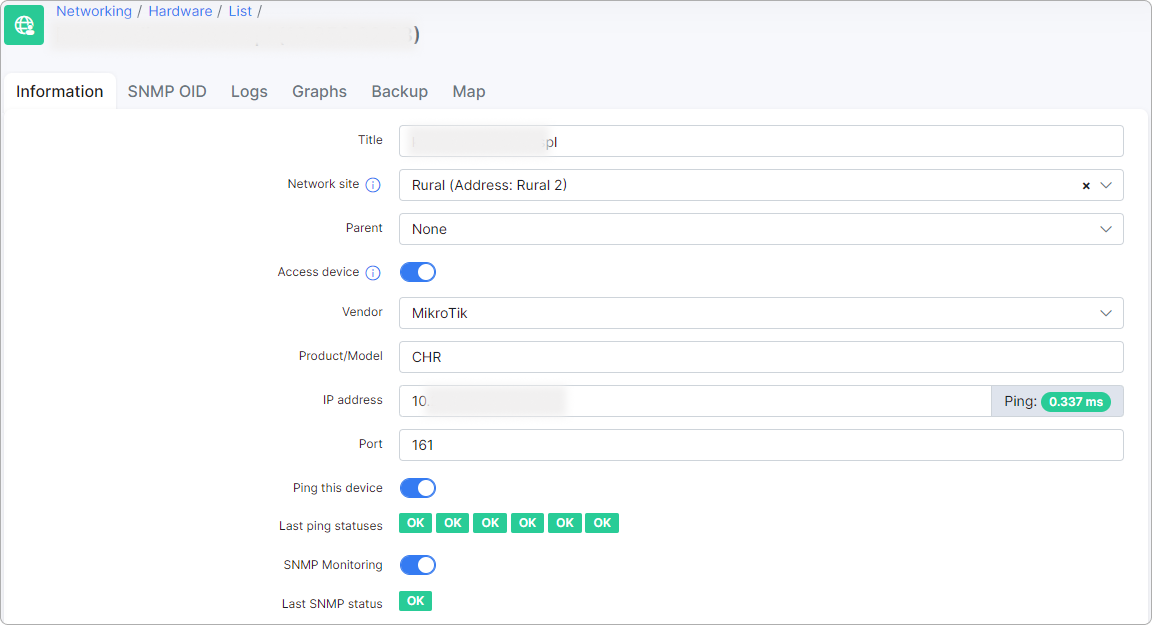
Here, Splynx can ping this IP. If the device is unreachable, the ping also fails, and the Last ping statuses will be negative.
¶ Actions with devices
To manage several devices at once, select them in the list and open the Actions menu:
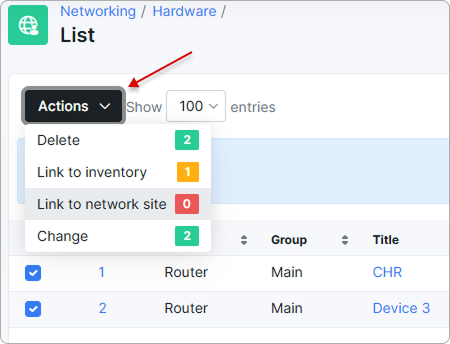
- Link to inventory — link the selected device(s) to an inventory item, so the same unit is tracked in both modules.
- Link to network site — link the device(s) to a network site. If a device is linked to an inventory item, that item is automatically linked to the same network site.
- Delete — remove the selected device(s).
Deleting a device that is linked to an inventory item shows a warning and asks whether to delete only the hardware device or the linked inventory item as well. Choose the option you need, then confirm.
¶ SNMP OID
That was the initial configuration to get the ping and SNMP status of the device. To monitor advanced parameters, you can use SNMP OIDs to read values and measure such things as CPU performance, memory usage, voltage, or interface speed. First, you need to get the available SNMP OIDs to build graphs. You can do this under the SNMP OID tab:
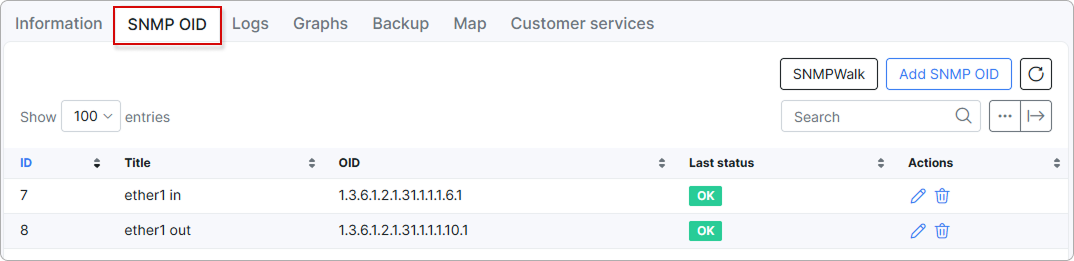
You can run an SNMP walk to get all available OIDs, or add one manually using the Add SNMP OID button. Click SNMP walk to load the OIDs automatically and avoid manual input mistakes:
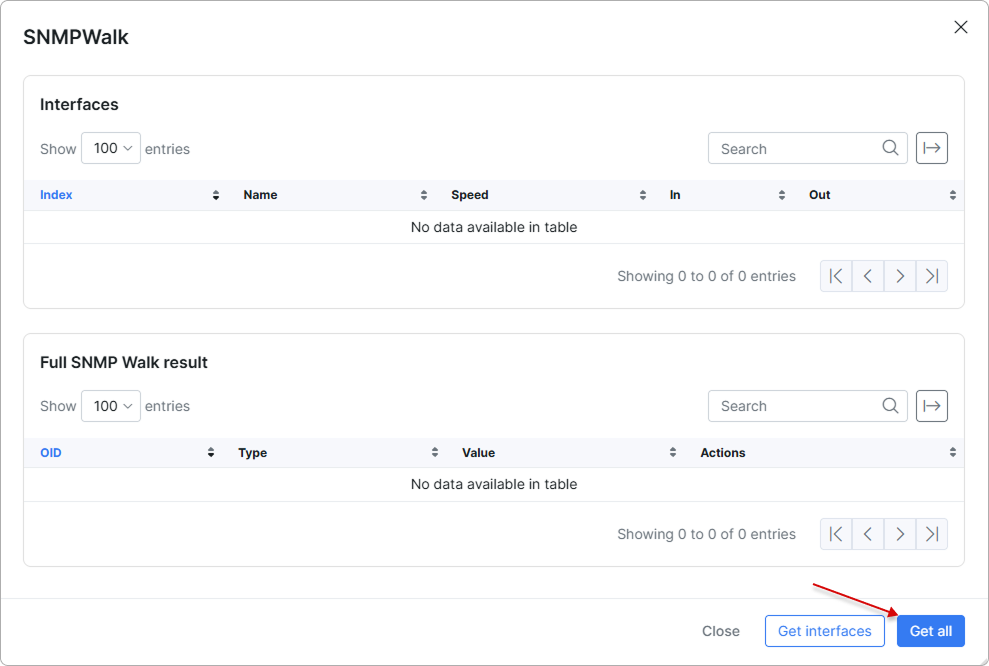
Here you can load all OIDs or interfaces only. Click the Get all button and wait 1-2 minutes for the result.
Once this is done, click SNMP walk to see all OIDs received from the device:
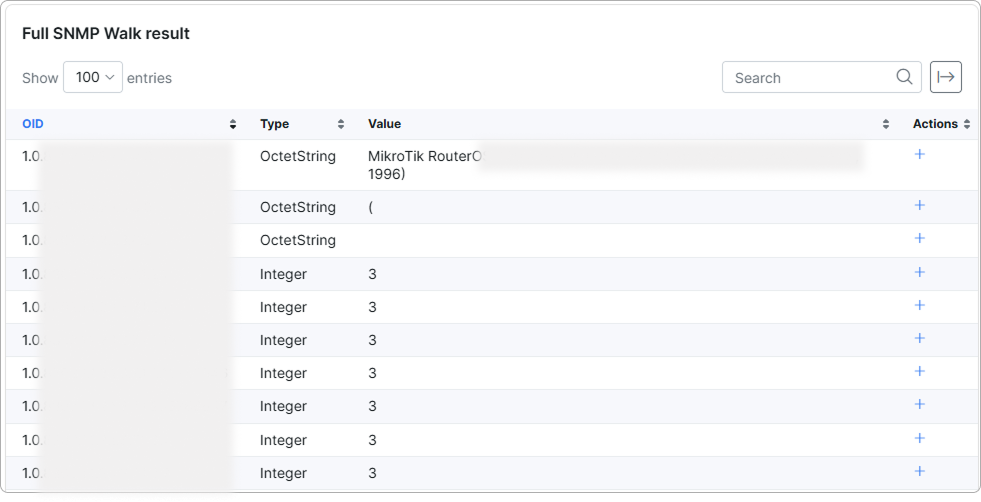
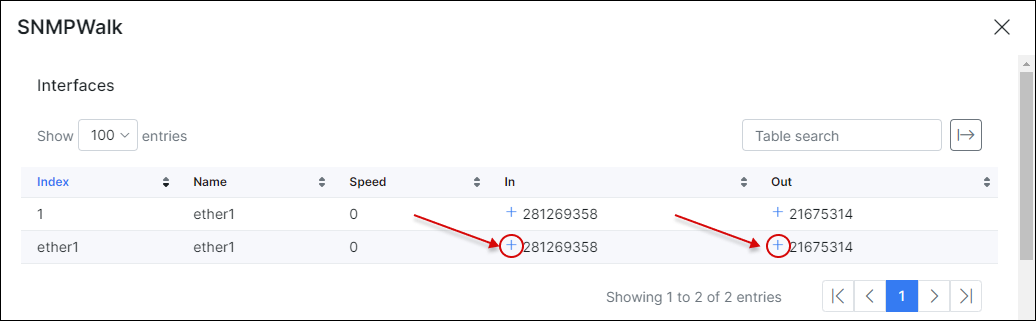
For example, to monitor the ether1 port bandwidth, click the + button next to these values:
First, add the OIDs. Next, build a graph. Make sure you specify the RRD Data Source Type (for example, Counter) to build a graph.
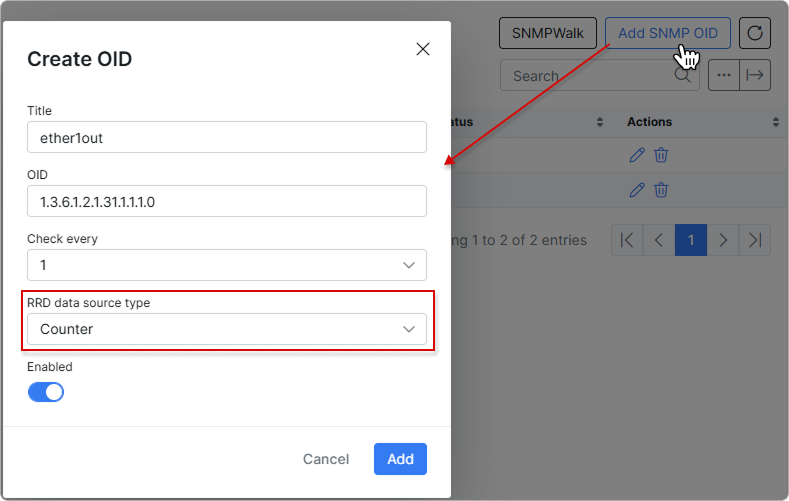
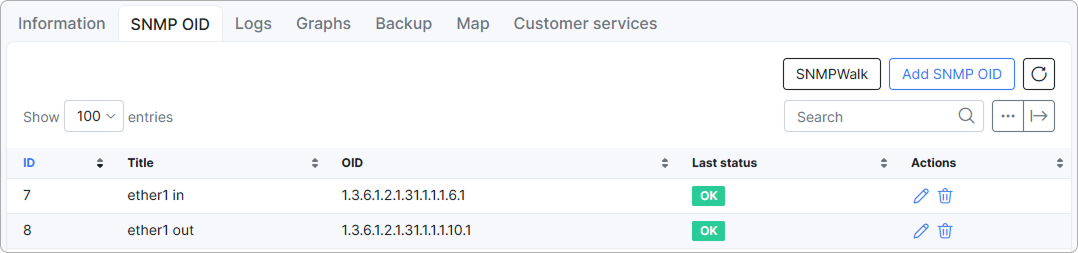
As a result, two SNMP OIDs are added for monitoring the in/out values of the ether1 interface. Now you can create a graph with these OIDs.
¶ Logs
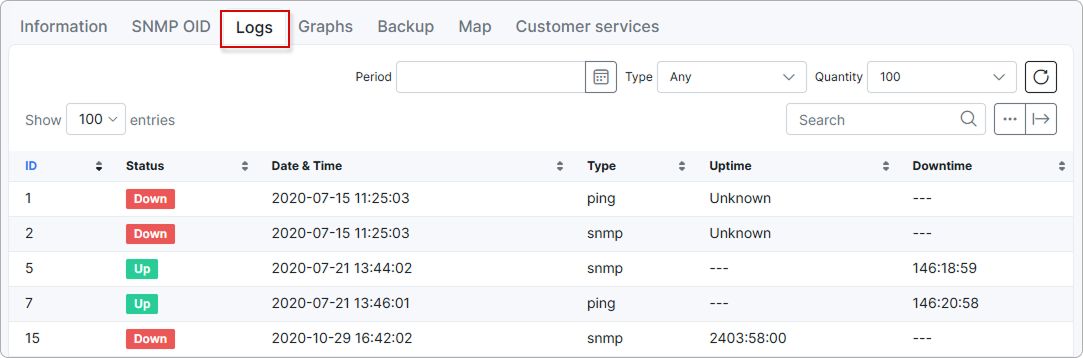
Under the Logs tab you can find monitoring log records:
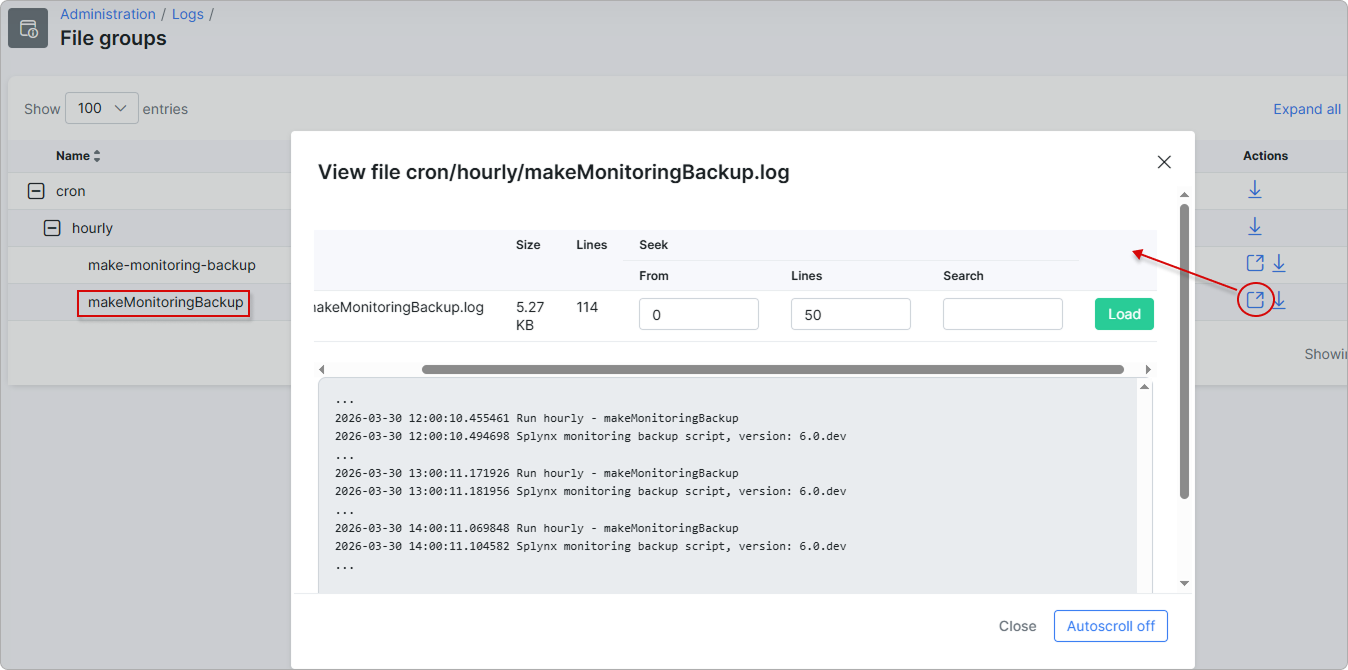
To check monitoring device backup logs, go to Administration → Logs → File groups and search for the cron/hourly/makeMonitoringBackup file:
¶ Graphs
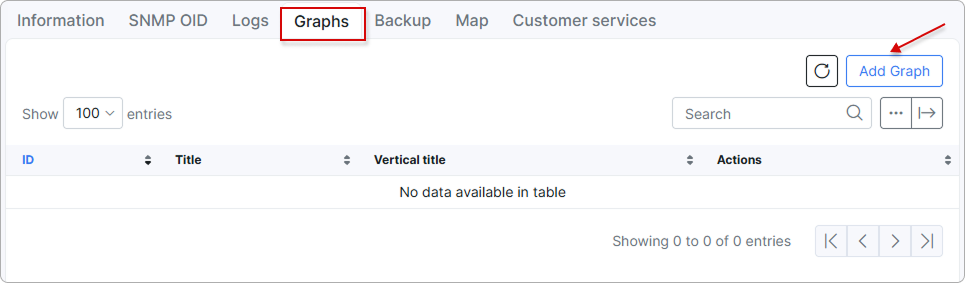
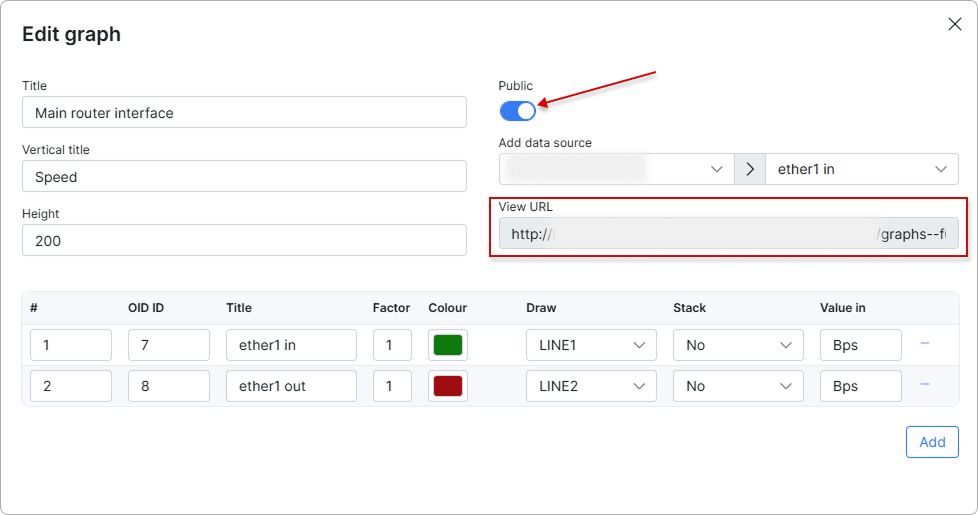
To build a graph, switch to the Graphs tab and click Add Graph:
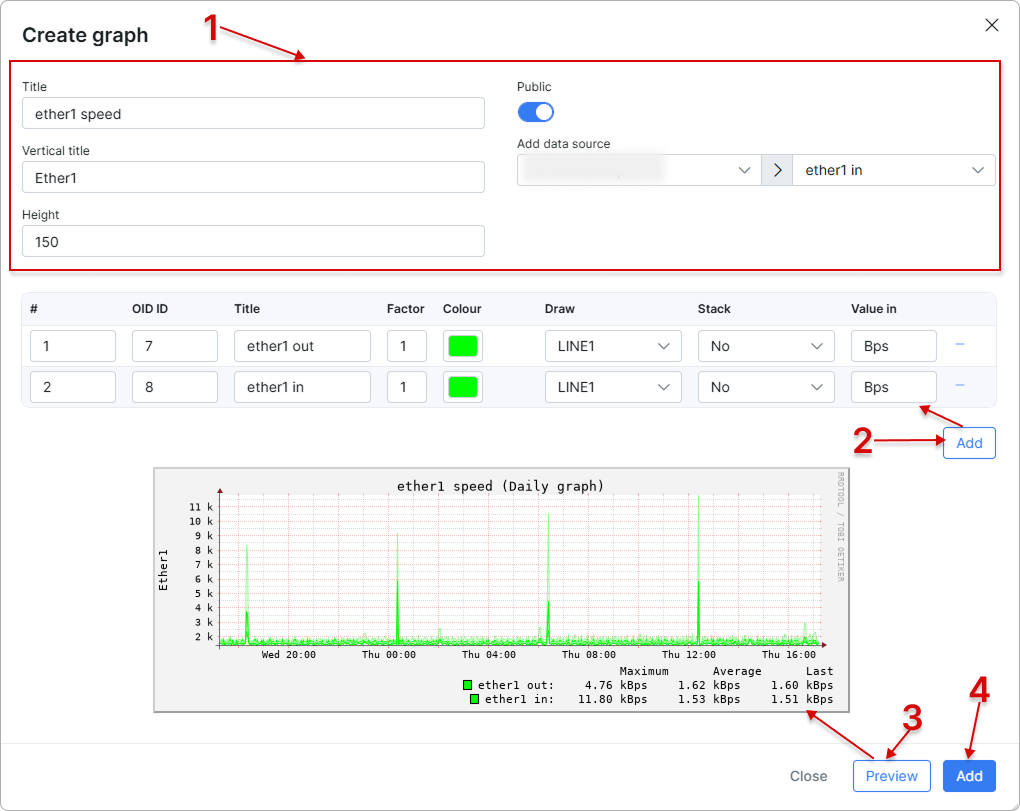
Here you need to specify the title and vertical title, and—most importantly—add the data sources. In this case, select the ether1 in data source and click Add, then select ether1 out and click Add. If you are measuring the interface speed, the factor value should be 8 and the value in field should be Bps. Click the Color field to select a color, and click the Draw field to select how data is displayed (line or area). Click the Preview button to generate a preview, and click the Add button to create the graph.
Now, under Actions, you can click the Edit, View graph, and Delete buttons next to each graph. Click View graph:
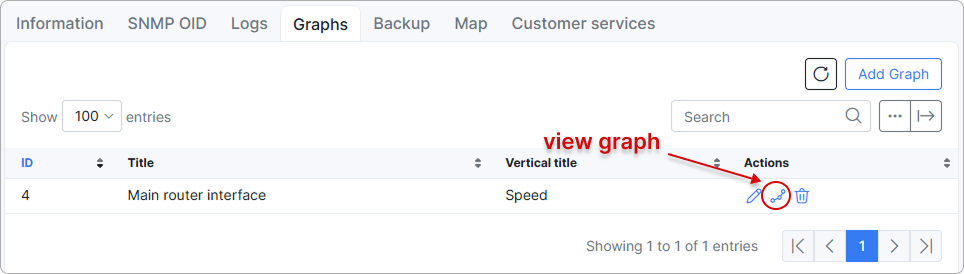
You can select different time periods here.
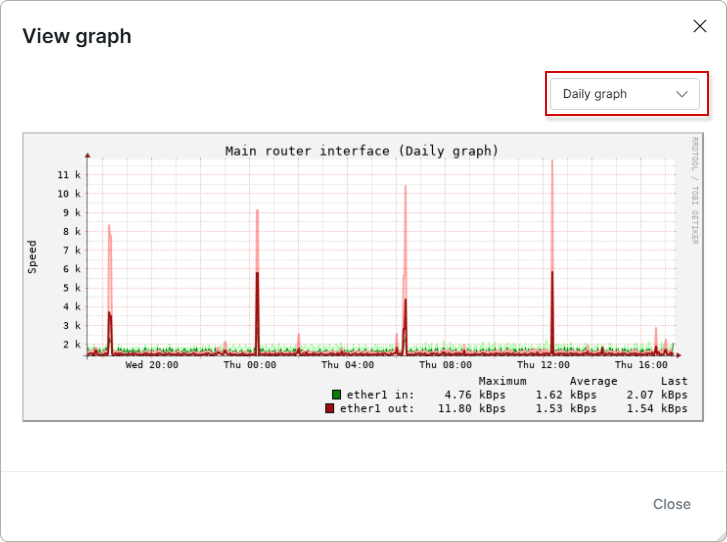
You can make the graph publicly available via a URL link to use it outside the Splynx instance:
¶ Backup
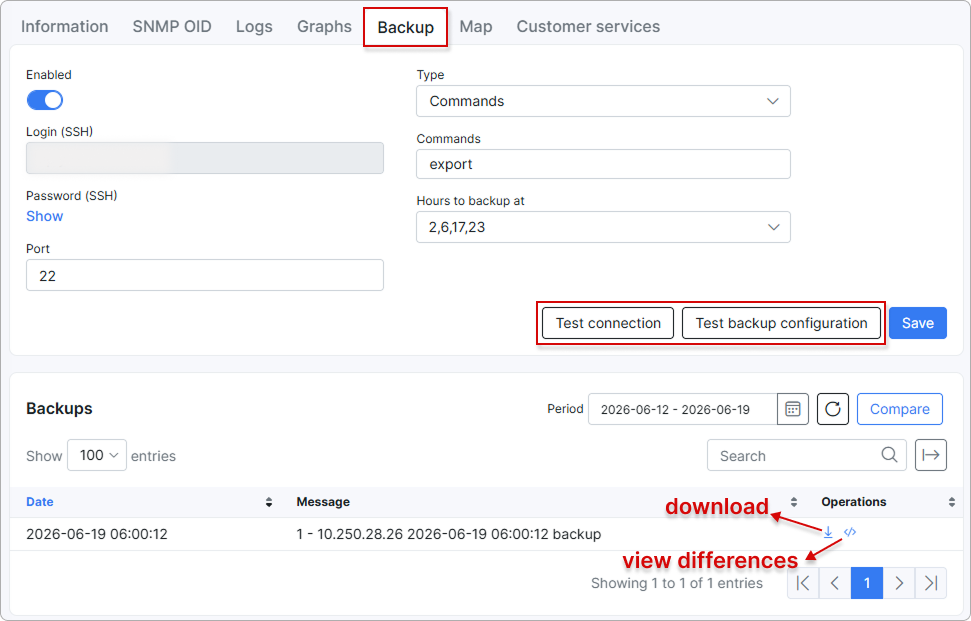
Splynx can perform backups of the device by logging in via SSH and executing commands that output the device's configuration. Configure the login credentials, the port used for the SSH connection, one or more commands to execute, and the hours at which you want backups to run:
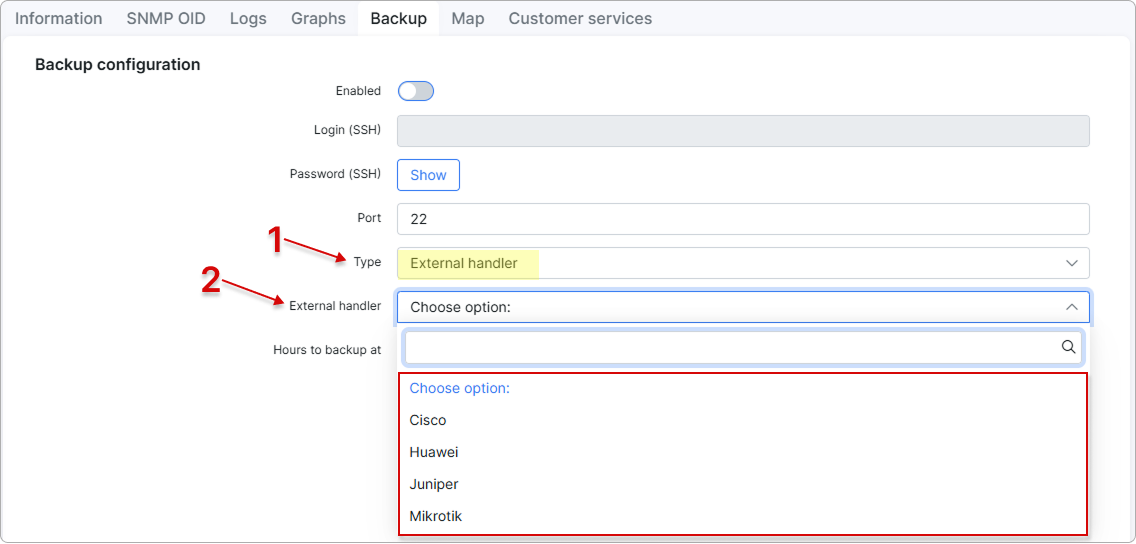
You can also choose an external handler as the backup type and select the appropriate external handler for the backup process from the list:
Click Test connection and Test backup configuration to ensure it works:
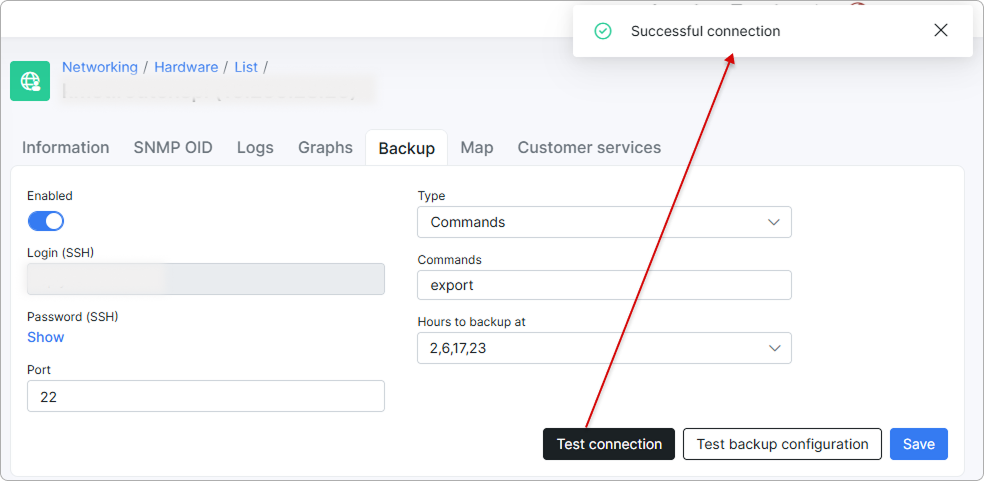
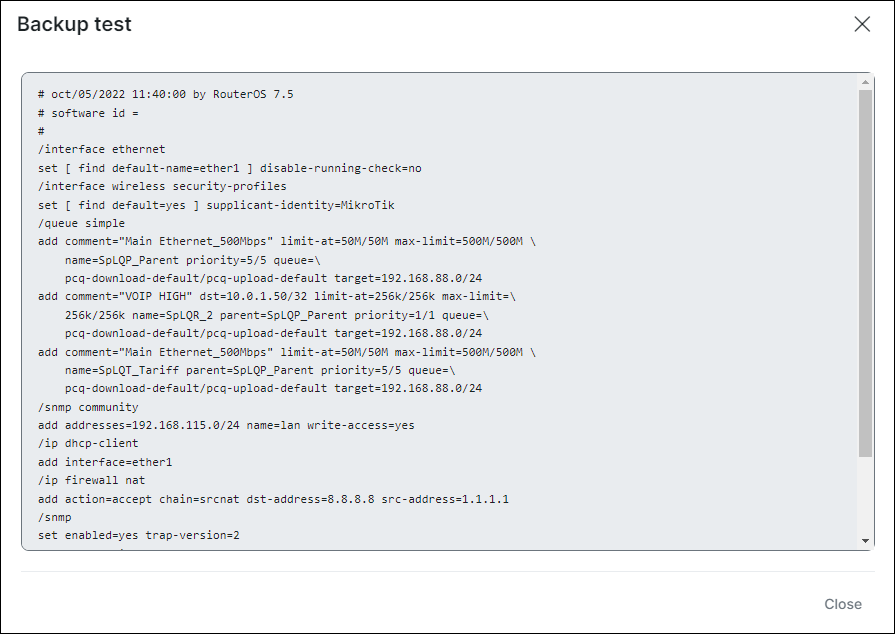
In the example above, the MikroTik export command is used to export the full configuration of the router. With other vendors this is usually possible by executing similar commands; for example, with Cisco devices you can achieve the same with the show running-config command.
You can find a list of all backups for a single device at the bottom of the Backup tab. To view a list of all backups for all devices, go to Networking → Hardware → Backups:
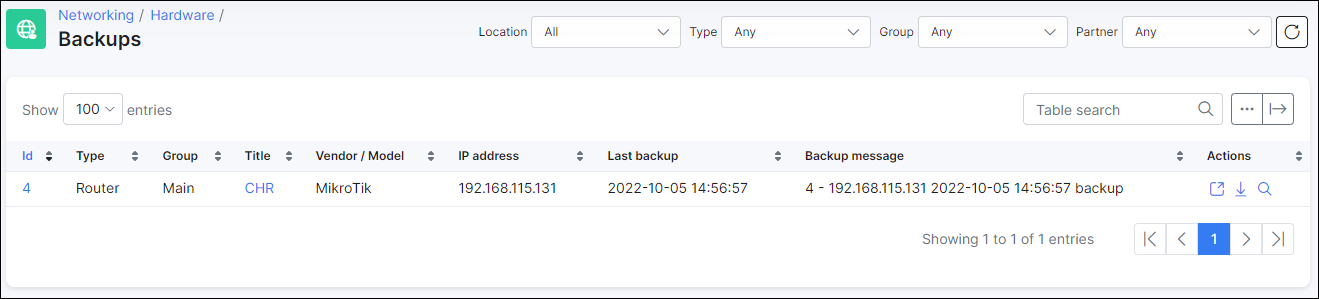
Under Actions, there are the following buttons:
 View difference button: to see the difference between backups, you need at least 2 backups.
 Download button: you can download the last backup.
 Search button: search for any word in the backup:
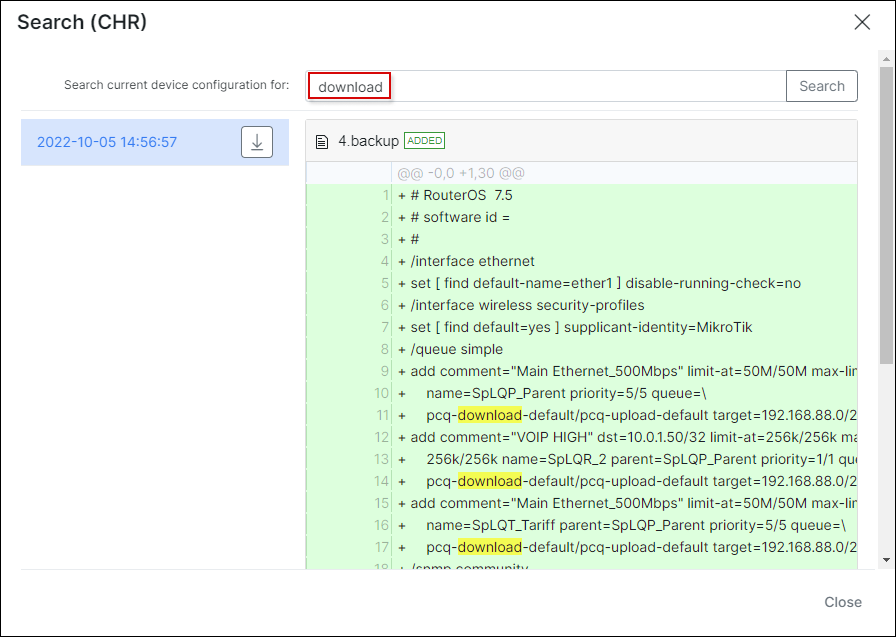
To eliminate duplicates, Splynx only creates a backup if differences are found compared with the previously made backup of the device.
¶ Map
You can set coordinates for your hardware and mark its location on the map. The corresponding legend then appears in the designated area.
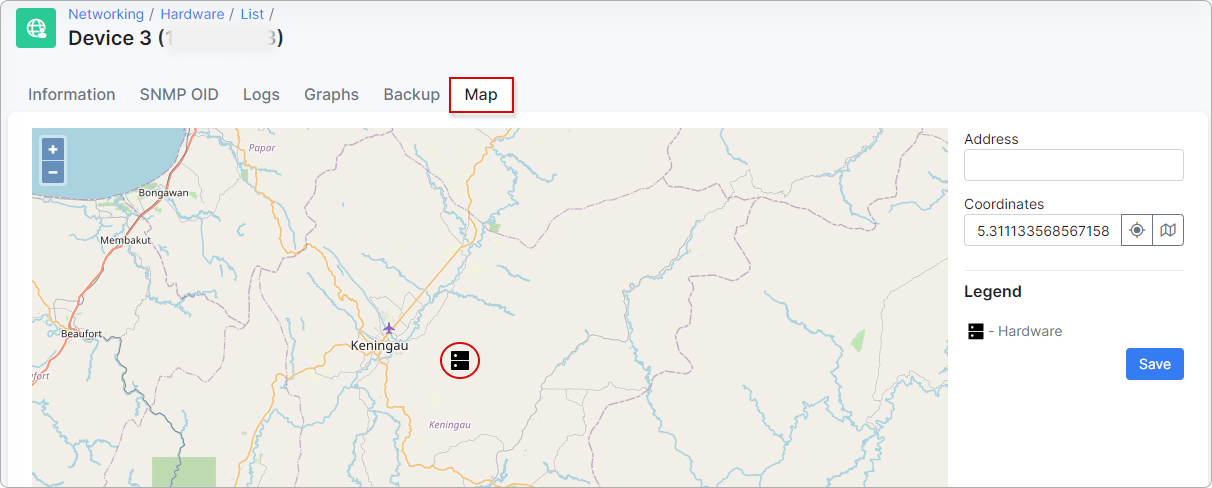
 - Place the hardware on the map by clicking this button.
 - Set the coordinates according to the address specified above.
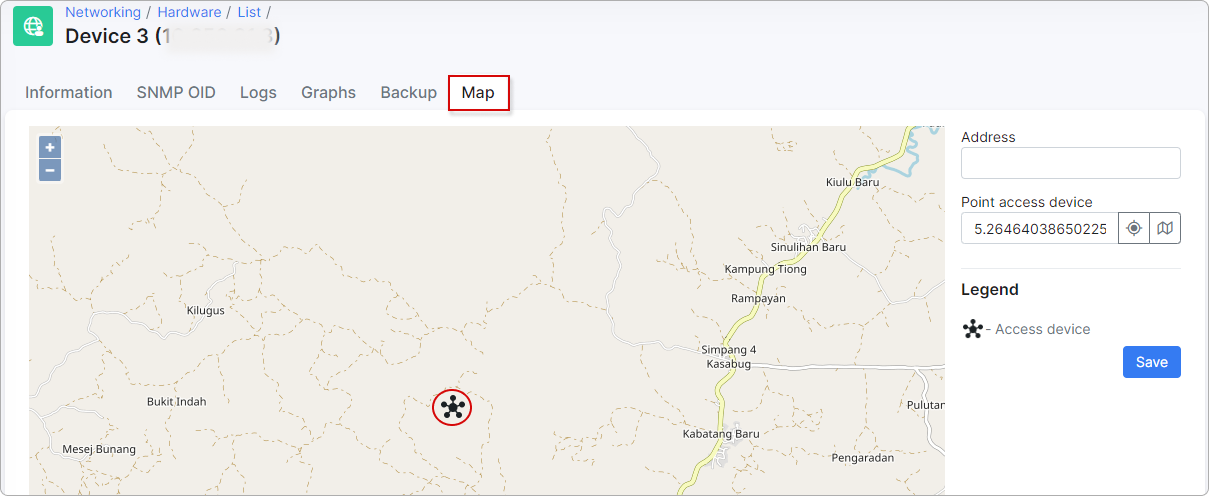
If the Access device toggle is enabled when adding a new hardware device, or later in the Information tab, the device becomes accessible for network sites and services to link to. You can then perform the same actions with it in the Map tab, but the legend changes to that of an access device.
¶ Customer services
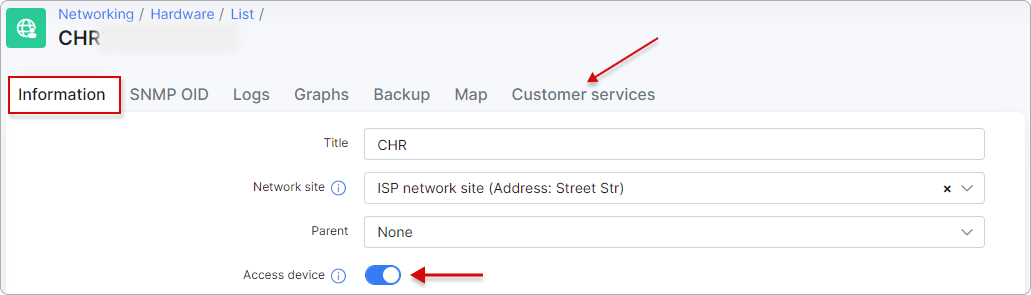
This tab appears on a hardware device when the Access device toggle is enabled under the device's Information tab:
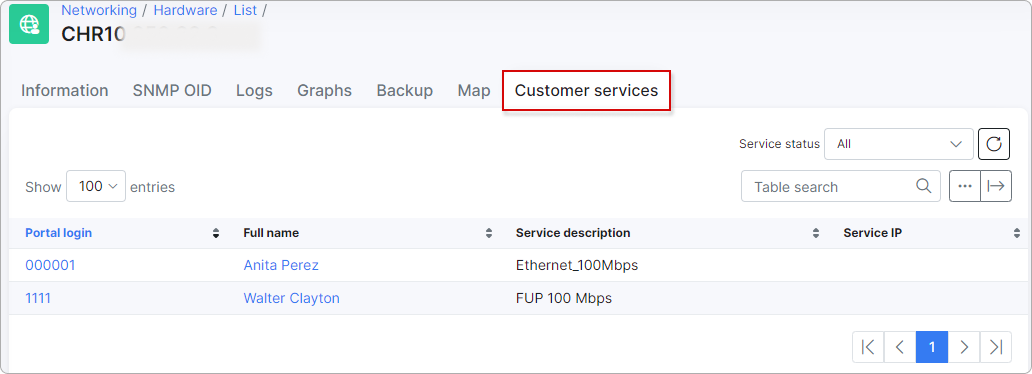
If the hardware device has linked services, they appear in the table under the Customer services tab, showing the customer's name, login, and service description:
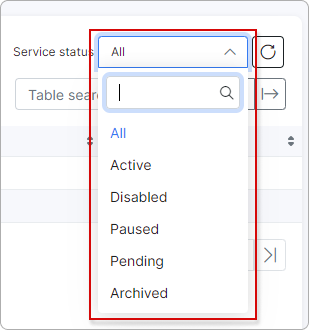
You can filter the entries in the table by Service status:
For more information on how to link hardware devices and services to network sites, read the Network sites article.

¶ Notifications
You can send a notification when a device goes down. First, add a notifications group under Config → Networking → Hardware:
Scroll down and find the Groups section:
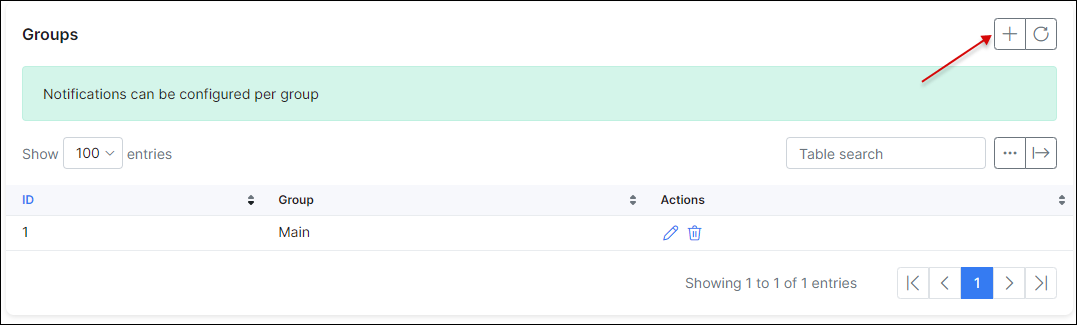
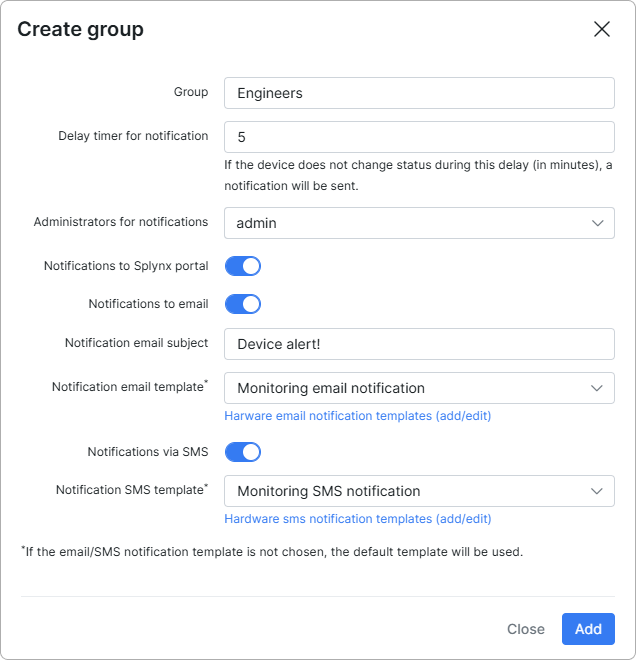
With this setup, you can create a group Engineers that consists only of the administrator admin. This administrator receives an email notification and a portal notification on the dashboard. The email subject is Device alert!, and the message body is defined by an email template that can be updated.
After this, change the group for the device:
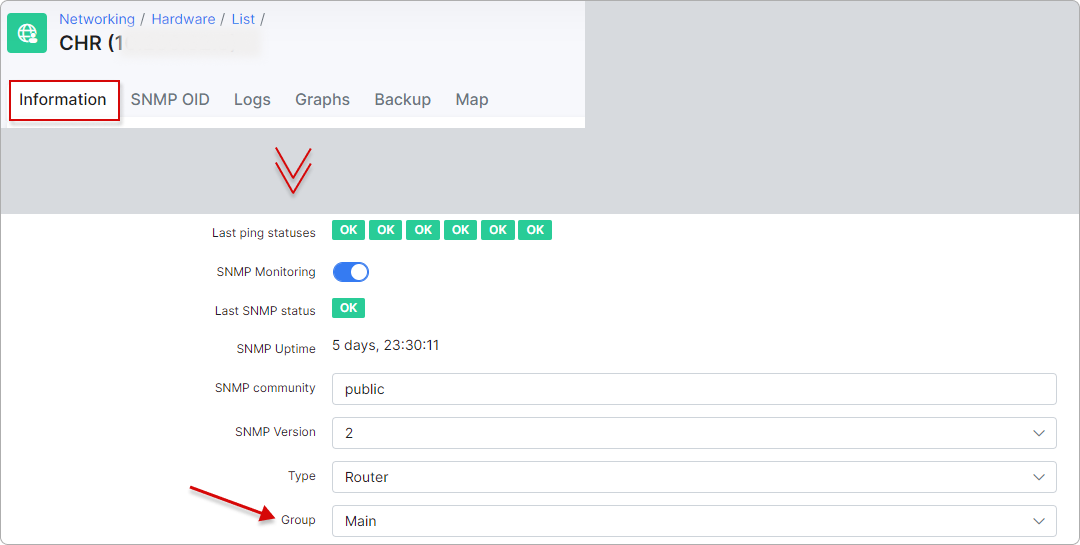
According to this device configuration, an administrator from the Engineers group receives a notification if the device is down for more than 10 minutes.
Follow the video tutorials to find out more about Splynx monitoring:
Ping tools:
CPU usage:
Memory usage: