¶ Total customers report
¶ Overview
The Total customers report shows how your customer base changes month by month over a selected period. For each month it gives you the number of customers you started with, everything that added to or removed from that base (new sign-ups, deletions, restorations, and transfers between partners or locations), the internal status churn (customers blocked or reactivated), and the number of customers you ended the month with.
The report answers a simple question — "how did my customer count get from the start of the month to the end of the month, and what drove the change?" Every movement is accounted for, so the closing number of one month matches the opening number of the next.
It also provides the data behind the Customer status chart.
To open the report, go to Administration → Other reports → Total customers report.

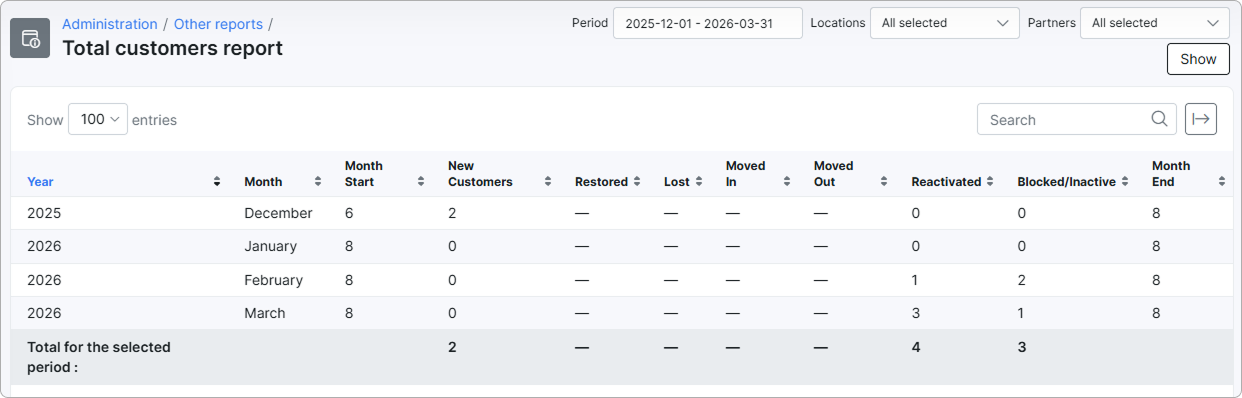
¶ Filters
The controls at the top of the report set which customers and which period are included. After changing any filter, click Show to reload the report.
- Period — the date range the report covers. Each month that falls inside the range becomes one row. The default is the current calendar year.
- Locations — limits the report to one or more locations. The default is All selected.
- Partners — limits the report to one or more partners. The default is All selected.

The Moved In and Moved Out columns only carry a value when you filter by a single partner or location. When both filters are left at All selected, transfers cannot move a customer in or out of the base, so these two columns show a dash (—).
¶ Table columns
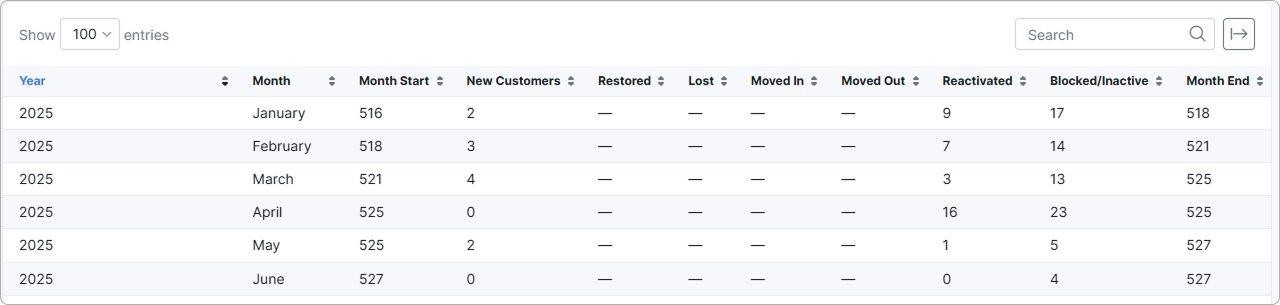
Each row is one month. The rows are grouped by Year and Month and sorted from the earliest month in the period to the latest. A totals row at the bottom (Total for the selected period :) sums the movement columns across the whole range.
The customer base counted here is the total number of customers in all statuses — Active, Blocked, and Iactive — but not leads. A dash (—) means the value does not apply or is not available for that month (see Important notes).
| Column | Description |
|---|---|
| Year | The calendar year of the month. |
| Month | The calendar month the row describes. |
| Month Start | The total number of customers at the start of the month. This is the base the month builds on. |
| New Customers | Customers added to the system during the month (any status, leads excluded). Increases the base. |
| Restored | Customers who were previously deleted and were restored during the month. Increases the base. |
| Lost | Customers deleted (removed) during the month, leads excluded. Decreases the base. |
| Moved In | Customers who moved into the selected partner or location during the month. Increases the base. Shown only when filtering by a single partner or location. |
| Moved Out | Customers who moved out of the selected partner or location during the month. Decreases the base. Shown only when filtering by a single partner or location. |
| Reactivated | Customers whose status changed from blocked or inactive back to active during the month. Informational — it does not change the total base. |
| Blocked/Inactive | Customers whose status changed to blocked or inactive during the month and who were not reactivated before the month ended. Informational — it does not change the total base. |
| Month End | The total number of customers at the end of the month. This value becomes the Month Start of the next month. |
¶ How values are calculated
¶ Month Start and Month End
Month Start and Month End are read from Splynx's daily customer statistics — a snapshot of your total customer count taken automatically every day.
- Month Start uses the snapshot for the day before the month begins.
- Month End uses the snapshot for the last day of the month. For the current, unfinished month, it uses yesterday's snapshot instead of a future date.
If a particular day's snapshot is missing (for example, the daily job did not run), the report falls back to the most recent earlier snapshot, so the count is never left blank.
¶ New Customers, Restored, and Lost
These three columns are the movements that change the size of your customer base:
- New Customers counts every customer created during the month, in any status. Leads are not counted — a lead only appears here once it has been converted to a customer.
- Restored counts customers who had been deleted and were brought back during the month.
- Lost counts customers who were deleted during the month. Leads are not counted.
¶ Moved In and Moved Out
When you filter the report by a single partner or location, a customer can enter or leave that group without being created or deleted — by being moved to another partner or location, or by a lead being converted into a customer inside that group.
- Moved In counts customers who joined the selected partner or location during the month.
- Moved Out counts customers who left it during the month.
With no partner or location filter applied, these movements happen inside the same overall base and cannot change the total, so both columns show a dash (—).
¶ Reactivated and Blocked/Inactive
These two columns describe status changes within your existing customer base. Because the base counted by this report includes customers of every status, blocking a customer or reactivating one does not change the total — it only moves a customer between statuses. For that reason these columns are shown for information only and are not part of the monthly balance.
- Blocked/Inactive counts customers whose status changed to blocked or inactive during the month and who stayed that way through the end of the month.
- Reactivated counts customers whose status changed from blocked or inactive back to active during the month, where they had been blocked or inactive since a previous month.
¶ The net-accounting rule
A customer's status can change more than once inside a single month. The report only records the net result at the end of the month:
- If a customer is blocked and then reactivated within the same month, they are counted in neither Blocked/Inactive nor Reactivated — as far as the month is concerned, nothing changed for that customer.
- If a customer is blocked in one month and is still blocked at the end of it, they are counted in that month's Blocked/Inactive.
- If that same customer is reactivated in a later month, they are counted in the Reactivated column of the later month.
The same rule applies to the daily counting behind the report.
¶ The monthly balance
Every month reconciles from start to end using the columns that change the size of the base:
Month End = Month Start + New Customers + Restored − Lost + Moved In − Moved Out
Reactivated and Blocked/Inactive are deliberately left out of this formula — they are status changes inside the base, not additions to or removals from it.
¶ Example
Suppose you run the report for the current year with both filters left at All selected.
- In January you start with 8 customers, nothing is added or removed, and you end the month with 8.
- In April one customer is created. New Customers shows 1, which lifts the base from 8 to 9 — so Month End for April is 9, and that 9 becomes May's Month Start.
- Across the same months the Reactivated and Blocked/Inactive columns show several customers each. These reflect customers being blocked and later switched back to active. Because the report counts customers of every status, this churn does not change the total — which is why the base still grows by only the one New customer, not by the block/reactivate activity.
This is the value of the report: it separates real growth and loss (New, Restored, Lost) from internal status movement (Reactivated, Blocked/Inactive), so you can see what actually changed the size of your customer base.
¶ Important notes
- Future months show a dash in Month End. Until a month has finished, its closing total is not yet known.
- Leads are never counted. New leads, and leads that are later deleted, do not affect any column. A lead only enters the report once it becomes a customer.
- The base is a total count, not an active count. Month Start and Month End include active, blocked, and inactive customers. This is why blocking or reactivating a customer does not move the total.