¶ Invoice report
- Overview
- Filters
- Table
- How values are calculated
- Generate, print, and download
- Export and table management
- Important notes
- Related pages
¶ Overview
The Invoice report lists every invoice issued in a chosen period, with Net, Tax, and Gross figures per invoice and overall totals at the bottom. It is used by ISP administrators for VAT/tax accounting, revenue audits, and reconciling invoiced amounts against payments and tax declarations.
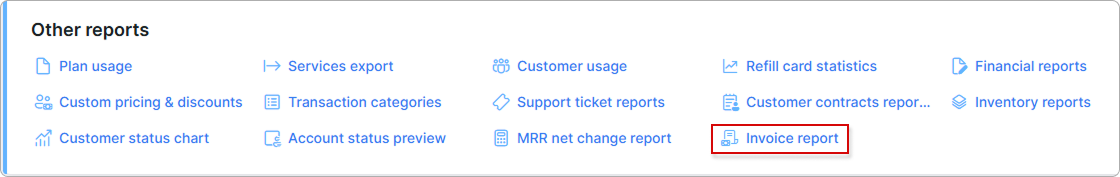
To open the report, go to Administration → Other reports → Invoice report. Access is restricted to the Super Administrator role; partner-scoped administrators see only invoices that belong to their partner.
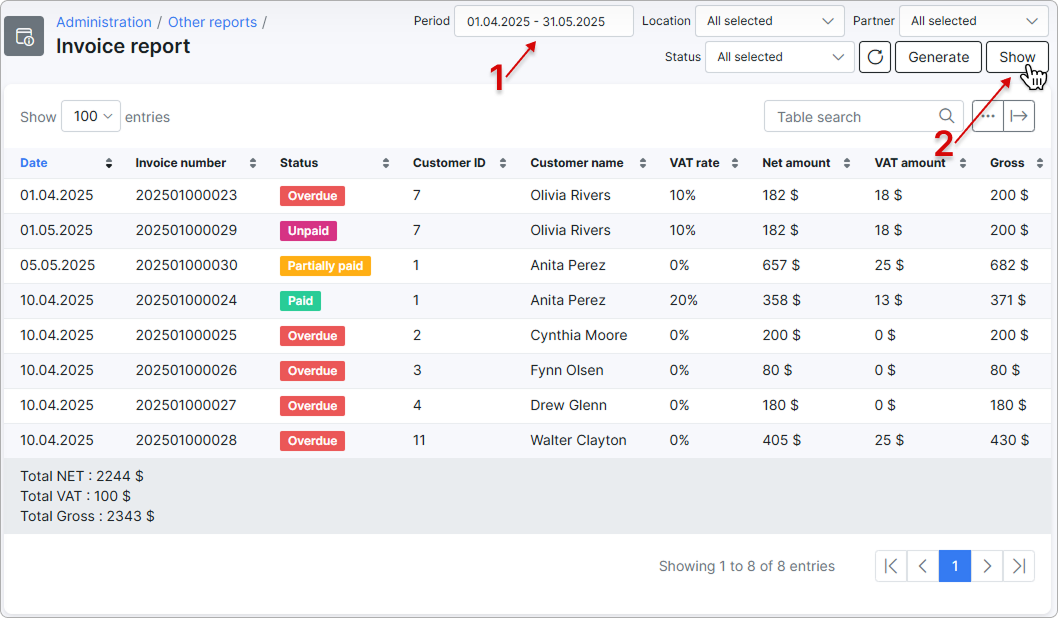
The report shows a per-invoice breakdown of all invoices issued to your customers within a selected date range, broken down into Net amount, Tax amount, and Gross amount. A footer row sums Net, Tax, and Gross across every invoice in the result set, so you can see the period's total invoiced revenue at a glance.
The tax column header uses the tax name configured in your system — for example, VAT rate, VAT amount, and Total VAT on a system that uses VAT, or the equivalent label for GST, MwSt., and other tax types.
¶ Filters
Each filter narrows what is included in the table and the totals. Set your filters and click Show to refresh the table, or Generate to open a printable version (see Generate, print, and download).
- Period (From / To) — the date range to include. Defaults to the first and last day of the current month. The report uses each invoice's creation date — invoices created within the range appear, regardless of their due date or paid date.
- Location — limits the report to customers assigned to one or more locations. Defaults to All selected.
- Partner — limits the report to customers assigned to one or more partners. Defaults to All selected. Partner-scoped administrators cannot widen this filter beyond their own partner.
- Status — limits the report by invoice status. The dropdown offers Paid, Unpaid, Pending, Deleted, and Overdue. Defaults to All selected.
Overdue is a virtual status: it covers unpaid invoices whose payment due date is in the past. Combining Overdue with other statuses returns both sets — for example, selecting Unpaid and Overdue together returns every unpaid invoice plus every overdue invoice.
Splynx invoices can have other statuses too, such as Partially paid, Paid by deposit, and Due. These are not selectable in the Status dropdown — to see invoices with those statuses, leave the filter on All selected. The Status column in the table shows the actual status of each invoice.

¶ Table
Each row in the table represents one invoice. Rows are sorted by invoice date by default and can be re-sorted by clicking any column header. Use the search box at the top right of the table to filter the visible rows by any text value (customer name, invoice number, status, and so on).
The default columns are:
| Column | Description |
|---|---|
| Date | The invoice creation date. |
| Invoice number | The unique invoice number assigned by Splynx. |
| Status | The current invoice status, shown as a coloured badge — for example, Paid, Unpaid, Overdue. |
| Customer ID | The numeric ID of the customer the invoice was issued to. |
| Customer name | The customer's display name. |
| Tax rate (e.g. VAT rate) | The tax rate applied to the invoice, shown as a percentage. The header uses the tax name configured in your system. |
| Net amount | The total of the invoice's line items before tax. |
| Tax amount (e.g. VAT amount) | The total tax charged on the invoice. |
| Gross | The total of the invoice including tax. |
Additional columns are available — Transaction ID, Payment type, Agent, and any custom invoice or customer fields configured with show in list — and can be enabled through the Show/hide columns icon (see Export and table management).
The footer row at the bottom of the table sums the values across every invoice in the result set:
- Total NET — the sum of every invoice's Net amount.
- Total {Tax name} — the sum of every invoice's Tax amount (for example, Total VAT).
- Total Gross — the sum of every invoice's Gross.
These totals always reflect the current filter combination — change any filter and click Show to recalculate.
¶ How values are calculated
The Net, Tax, and Gross figures shown for each invoice are built up from the invoice's individual line items.
¶ Net amount
For each line item on an invoice, the Net amount is the line price multiplied by its quantity, before tax. The values for all line items on the same invoice are added together to produce the Net amount shown in the row.
¶ Tax amount
For each line item:
- If the line item has a tax rate greater than zero, the Tax amount is the line's gross total minus its Net amount.
- If the line item has no tax rate (0%), its Tax amount is zero.
The Tax amounts of all line items on the same invoice are added together to produce the Tax amount shown in the row.
¶ Gross
The Gross value for an invoice is the sum of Net amount and Tax amount — every line item's total including tax.
¶ Tax rate column on mixed-rate invoices
If an invoice has line items with different tax rates (for example, one line at 5% and another at 20%), the Tax rate column shows the rate of the last item processed for that invoice rather than a combined rate. The Net amount, Tax amount, and Gross values still reflect every line item correctly — only the displayed rate is a single value.
If you need a precise per-rate breakdown for mixed-rate invoices, use the Tax summary report instead.
¶ Footer totals
The footer row sums the per-line values across every invoice in the result set:
- Total NET = sum of every line item's Net.
- Total {Tax name} = sum of every line item's Tax.
- Total Gross = sum of every line item's Gross.
¶ Generate, print, and download
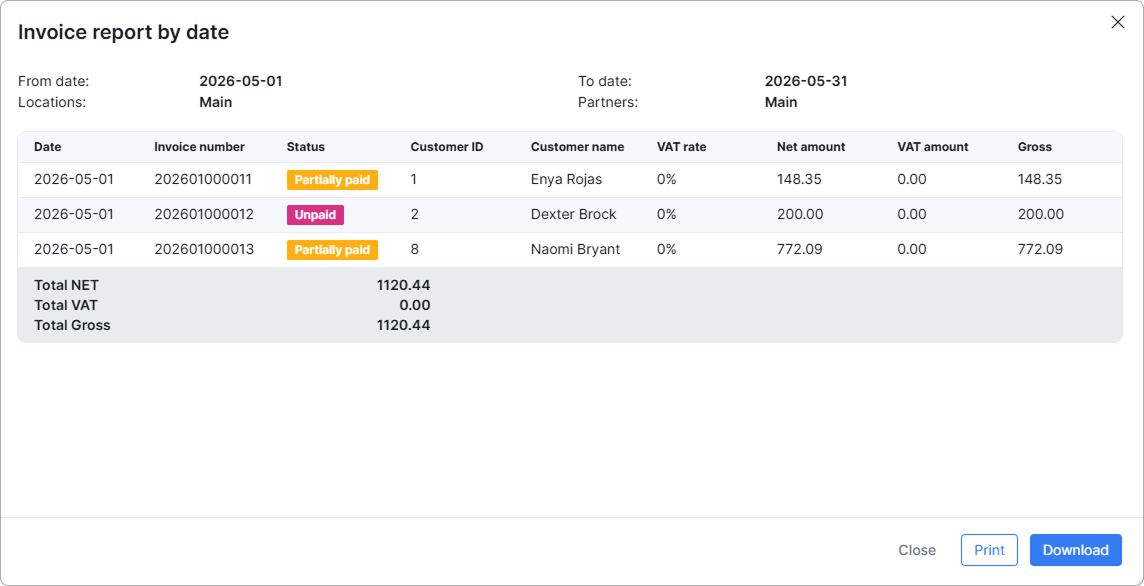
The Generate button opens a print-ready view of the report in a modal. The header of the modal restates the filter context — From date, To date, Locations, and Partners — so the printed or saved file is self-explanatory.
From the modal you can:
Print— opens your browser's print dialog so you can print the report directly or save it as a PDF.Download— saves the report as a self-contained.htmlfile named after the selected date range. The file can be opened in any browser without access to Splynx.
¶ Export and table management
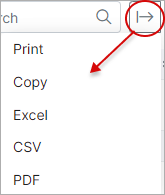
The table can be exported by means of the export  icon located at the top right of the table. You can then export using a format of your preference from that which is available:
Use the Show/hide columns button  to enable, disable, or reorder columns. This is also where you can add hidden columns such as Transaction ID, Payment type, Agent, and any custom fields configured for invoices or customers.
¶ Important notes
- The Period filter is applied to the invoice creation date only. Payments received outside the period (for example, an invoice from March that was paid in May) do not move the invoice in or out of the result.
- All money values are shown using your system's default currency formatting. Per-customer currencies are not converted.
- Deleted invoices are included only when Deleted is selected in the Status filter.
- Partner-scoped administrators always see only their partner's data — the Partner filter is forced to their own partner and cannot be widened.
- The Status dropdown does not list every possible invoice status. Statuses such as Partially paid, Paid by deposit, and Due still appear in the Status column, but you cannot filter for them directly — leave the Status filter on All selected to see them.