¶ Dashboard
- Overview
- Info blocks
- Shortcuts
- Connected customers
- Live dashboard
- Main sidebar
- Top bar features
- Notifications
¶ Overview
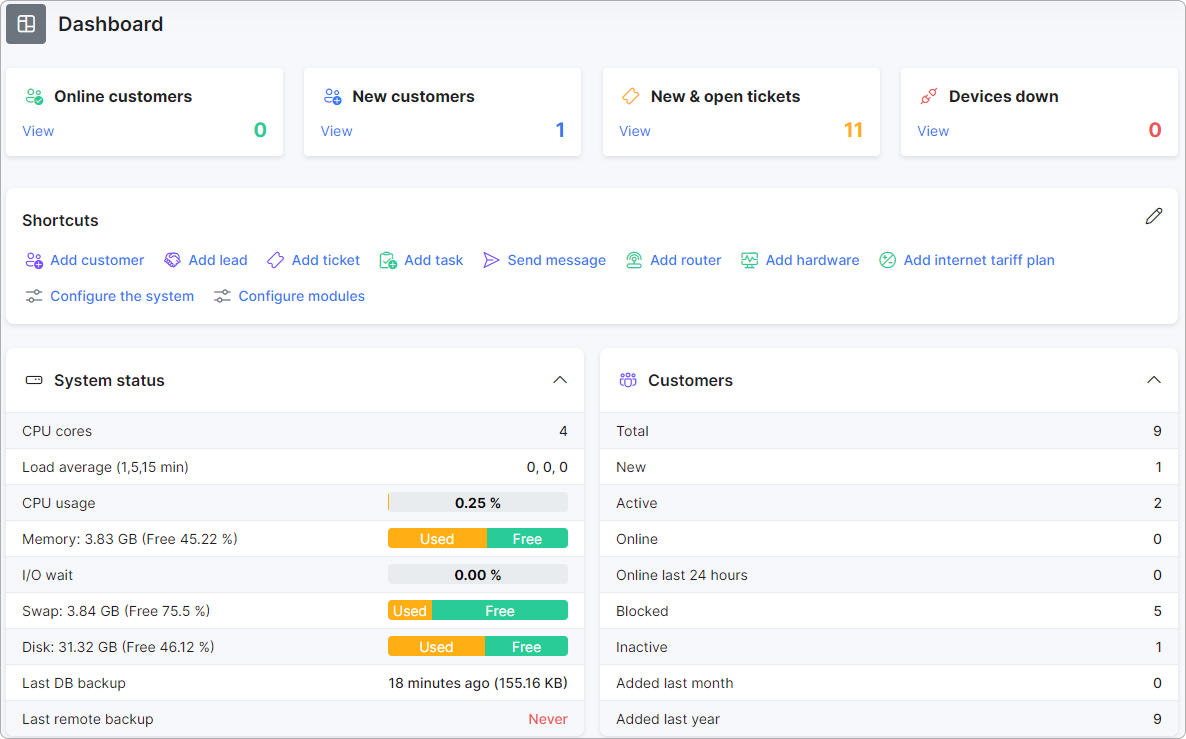
Dashboard is the main control page in Splynx. It allows you to check financial and customer statistics on a daily basis. From the dashboard, you can monitor system performance and promptly access information about the health of your network devices and the status of other modules.
¶ Info blocks
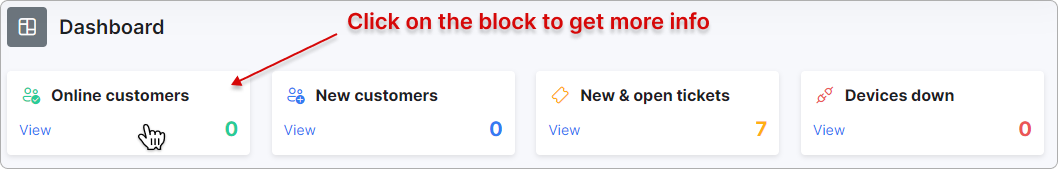
At the top of the live dashboard, you will find blocks that provide summarized information about the following:
- The number of online customers.
- The number of new customers.
- The count of new and open tickets.
- The number of devices down in your network.
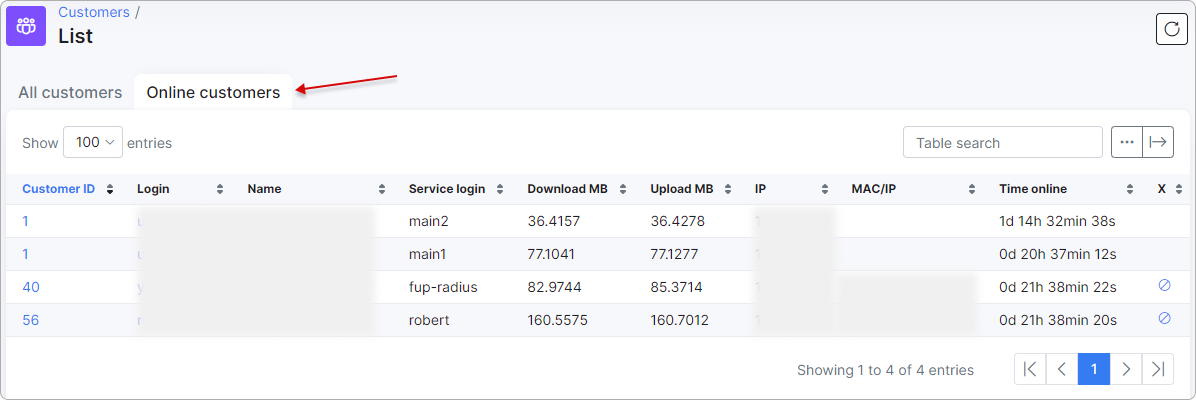
To access a more detailed list of the data presented in these blocks, simply click on the desired block. This action allows you to quickly navigate to the full list of necessary information.
¶ Shortcuts
The Shortcuts feature provides access to common actions in Splynx.
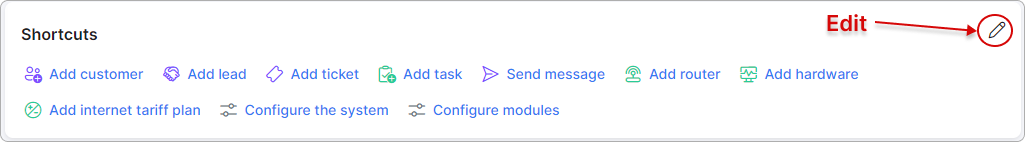
The available actions depend on the account's role and its permissions.
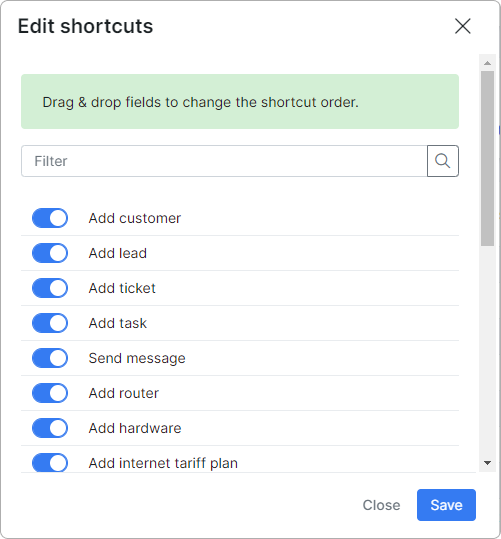
You can use this menu to enable or disable the desired items or change their order.
 When you install at least one add-on on the system, its item will become accessible in the Edit Shortcuts menu.
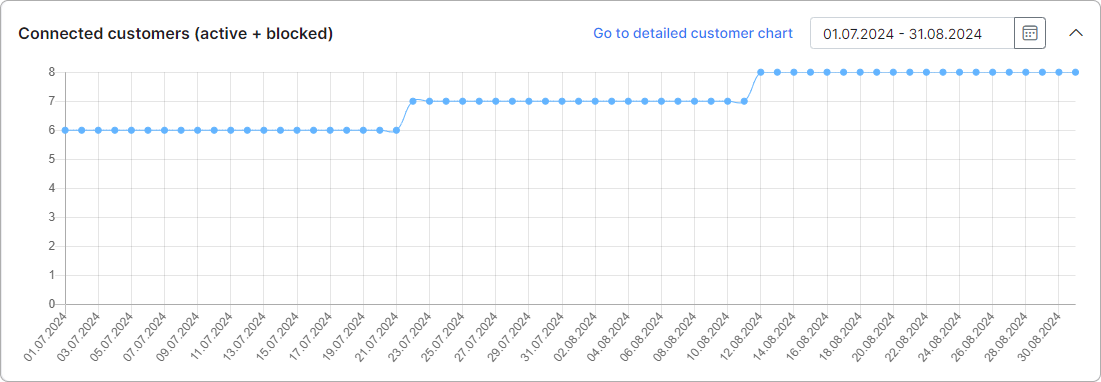
¶ Connected customers
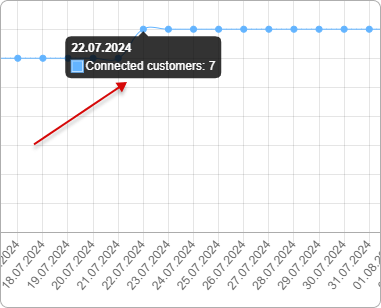
You can access customer statistics (both for Active and Blocked customers) based on their numbers and dates. This allows you to observe daily changes in the customer count within the system.
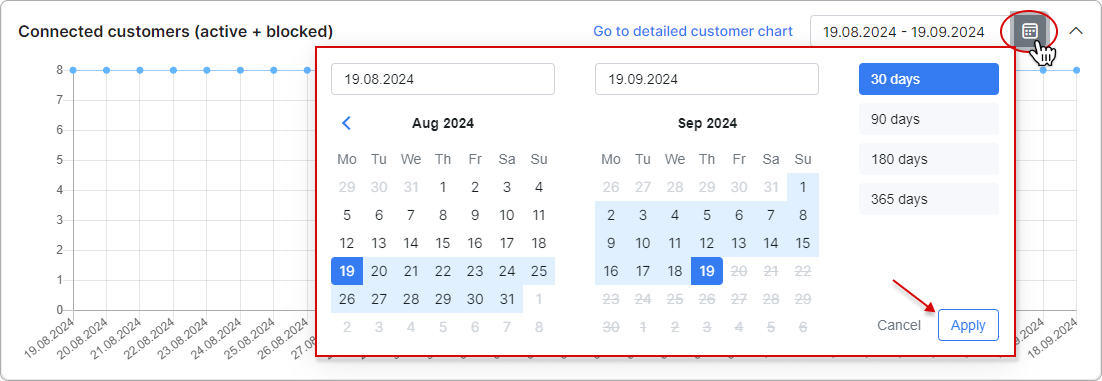
Click the calendar icon to select the date range, then click Apply:
To view the customer count for a specific date, simply hover over the corresponding area:
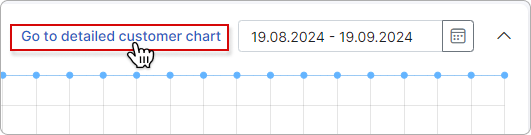
To view a more detailed customer chart that includes all statuses, click Go to detailed customer chart. You will be immediately redirected to Administration → Reports → Customers chart.
To learn more, please read
Statuses

¶ Live dashboard
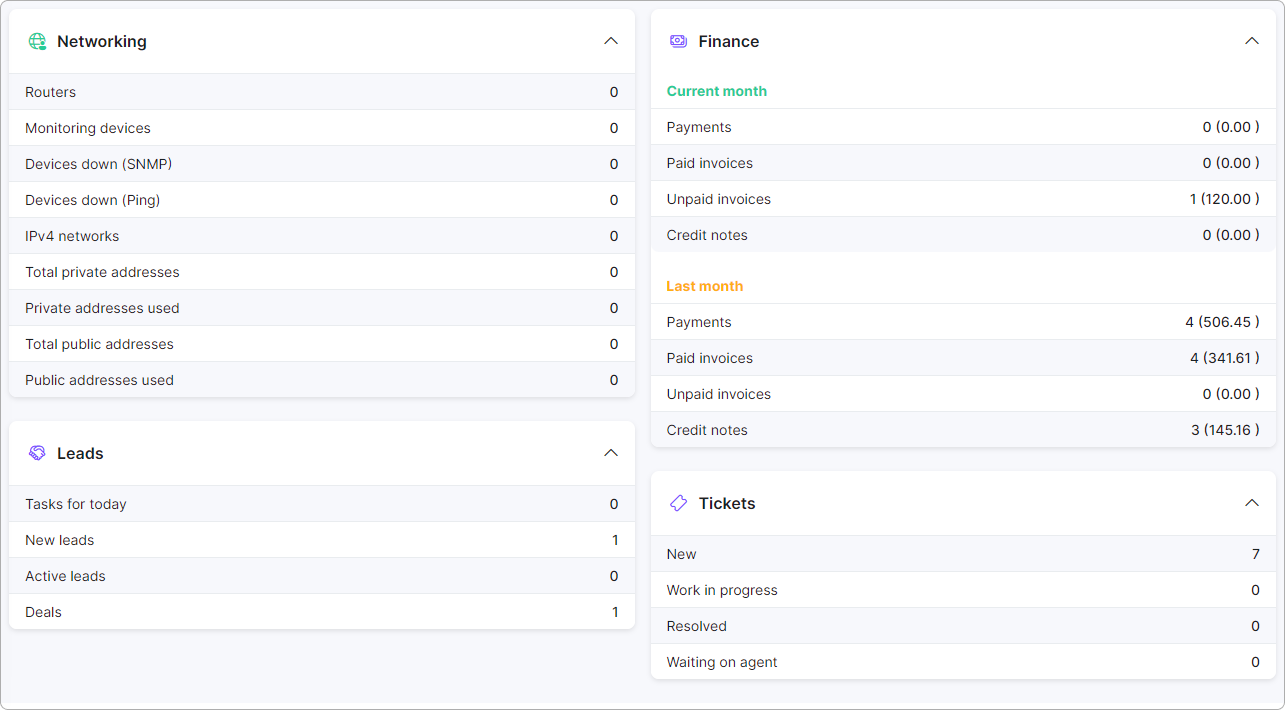
The Live dashboard is divided into 6 main parts:
 System status - displays information on free memory, the timestamp of the last database backup, the timestamp of the last remote backup, and more.
 Customers - represents statistics regarding new customers, active customers, those currently online, customers online today, and blocked customers, among others.
 Networking - provides a concise overview, including the number of routers, IPv4 networks, monitoring details, and both public and private addresses.
 Finance - features a convenient table with statistics for unpaid and paid transactions, debit transactions, and payments for the current month and the previous month.
 Leads - the total count of all leads, quotes, and deals in the system.
 Tickets - a quick list of tickets grouped by their respective status.
¶ Main sidebar
The navigation sidebar on the left side has the following modules:
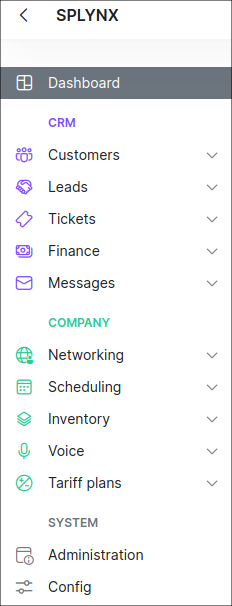
CRM
-
Customers - the configurable list of all customers in the system;
-
Leads - the configurable list of all leads in the system;
-
Tickets - the ticketing system and the place of support communication;
-
Finance - all aspects related to your finance;
-
Messages - the support communication system for all your customers;
COMPANY
-
Networking - the networking management platform;
-
Scheduling - the To Do list for your technical staff;
-
Inventory - the physical devices and the equipment are managed here;
-
Voice - the voice rates and CDR processing management;
-
Tariff Plans - the list of all your services and products in the system;
SYSTEM
-
Administration - the administrative page of your Splynx server;
-
Config - the place where all settings for each module are located.
¶ Top bar features

| Icon | Description |
|---|---|
 |
the list of recommended and additional steps for successful deployment. |
 Quick addition |
the following actions available: Add customer, Add lead, Add ticket, Add task, Add internet tariff plan. |
 Search |
the global search of Splynx. |
 Help and Support |
create a new ticket for Splynx support. |
 Documentation |
open the documentation in the sidebar. Each article can be opened in a new window. In addition, you can search for the guide you need by keywords. |
 Notifications |
the list of recent notifications. |
¶ Deployment guide
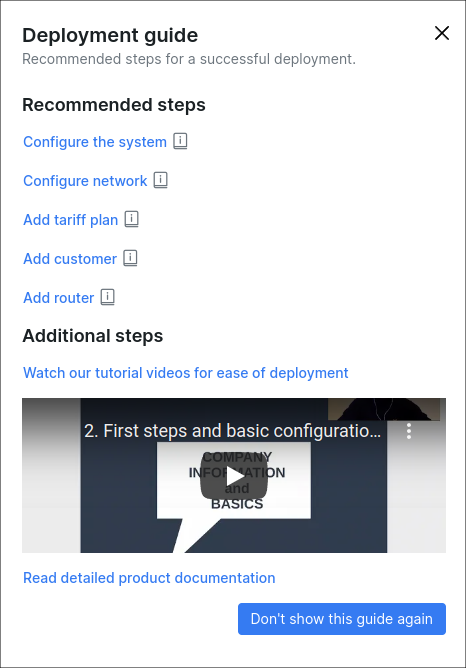
The must-have information and tutorials simplify system deployment for new users.
¶ Quick addition

If you are on some Splynx page, other than Dashboard, you can easily perform actions such as Add customer, Add lead, Add ticket, Add task or Add internet tariff plan by clicking on quick action icon.
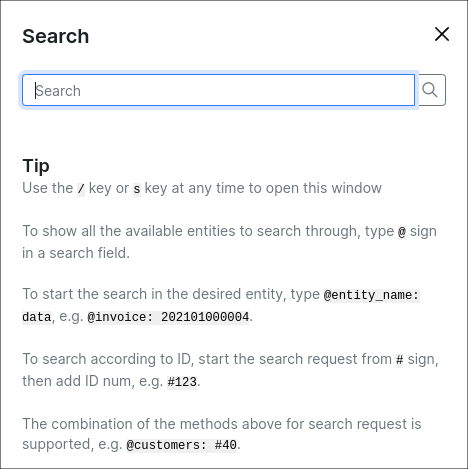
¶ Global search
¶ Help and Support
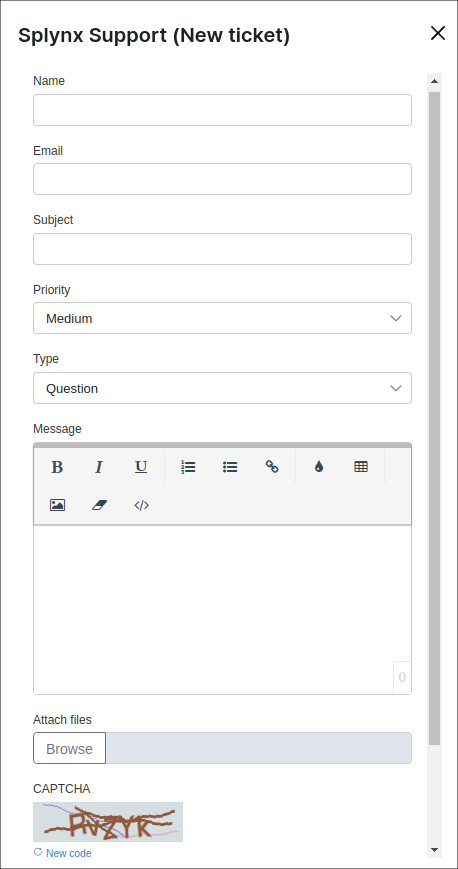
The action is used to create a ticket for Splynx support team. Please, use this option when it's strictly necessary and after the related documentation is examined.
¶ Documentation
![]()
It's provided the instant access to the appropriate documentation in the Splynx window. Depending on which page you are on, the necessary manual will be opened on the right sidebar after clicking on the icon or pressing the d hot key at any time. The manual can be opened in a separate tab of the web browser and you can navigate to the Table of contents of the full documentation or search the necessary guide as well.
¶ Notifications
By clicking the bell icon, you can view notifications about recent events in Splynx, such as receiving a new ticket:
![]()
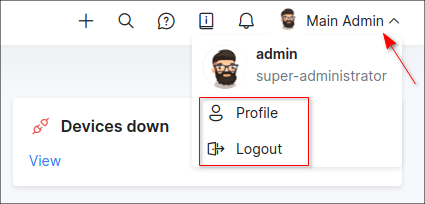
In the upper right corner of the page the ACCOUNT menu is located with the next modules:
-
Profile - the profile page of the administrator currently logged into the system;
-
Logout- the option to logout from the system
¶ Reminders in warning messages
When you receive warning messages on the Dashboard, you can set them to remind you later by clicking the Remind me button. Additionally, you can specify the time for the reminder: in 1 day, 1 week, or 1 month. The warning message will be shown again if it is still valid after the specified period of time.
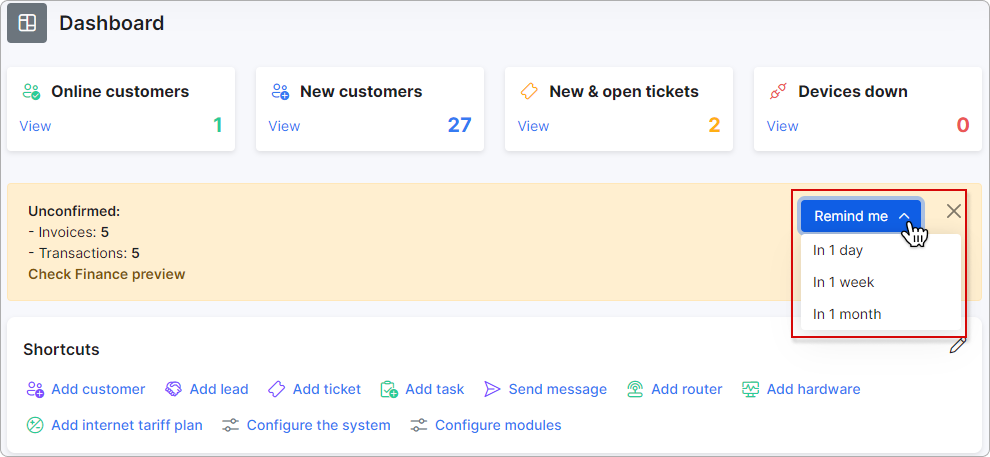
The reminder will appear for each admin, and each admin has to set their own reminder period.
¶ Slow hard drive notification
Some processes may fail if your hard drive is slow. Our system will automatically assess the performance of your hard drive, and if it detects slowness, you will receive the following notification on your Dashboard:
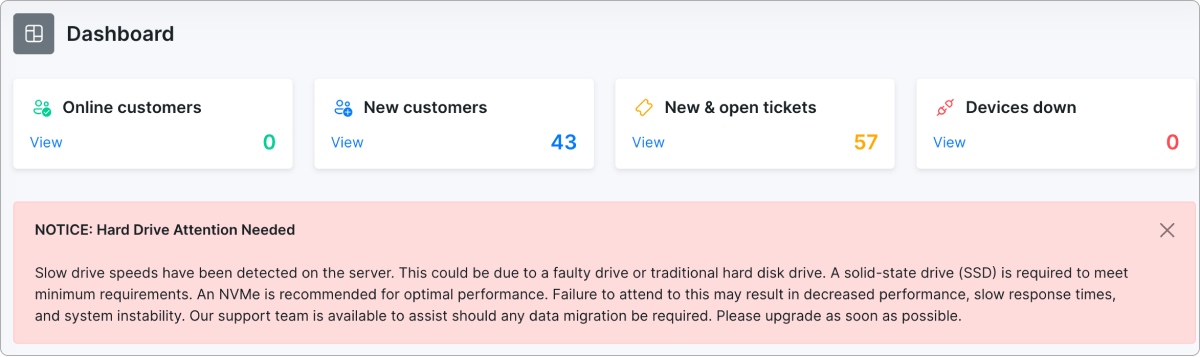
NOTICE: Hard Drive Attention Needed
Slow drive speeds have been detected on the server. This could be due to a faulty drive or traditional hard disk drive. A solid-state drive (SSD) is required to meet minimum requirements. An NVMe is recommended for optimal performance. Failure to attend to this may result in decreased performance, slow response times, and system instability. Our support team is available to assist should any data migration be required. Please upgrade as soon as possible.

Enjoy your work with Splynx!